Digital Infrastructure for Public Participation
The IES Cities platform is a novel and practical way of building the digital identity of a city. Nine technical partners, from industry to research, and four city councils are creating a platform for Internet-enabled services for citizens in the form of mobile urban apps. These apps are based on an open platform which obtains information from open government data and enriches them through citizens’ contributions. Companies, citizens, and councils interact and collaborate toward achieving a smarter city. ZIB performs research and development of the scalable, distributed storage back end.
© Luke Andrew Scowen, CC BY-SA 2.0, no changes
Internet-Enabled Services for Cities across Europe
The EU-funded project IES Cities provides a novel and practical way of building the digital identity of a city. Nine technical partners, from industry to research, and four city councils are creating Internet-enabled services for citizens in the form of a mobile urban app. These apps are based on an open platform which obtains information from open government data and enriches them through citizens’ contributions. Companies, citizens, and councils interact and collaborate towards achieving a smarter city. ZIB is responsible for research and development of the scalable, distributed storage back end.

The Apps
Each of the four pilot cities – Bristol, Majadahonda, Rovereto, and Zaragoza – developed four services available as apps for the Android platform. A common entry point into finding relevant apps is the IES Cities Player on Google Play. The individual cities’ apps are available on Google Play as well, but with the IES Cities player, a user can browse through all available IES Cities apps and filter them based on the apps’ descriptions and common tags, and also restrict search results to apps relevant for the user’s location. Since the PhoneGap framework has been used to develop the apps, some of them are also available as pure HTML 5 services for other mobile or desktop platforms. Some of the apps are presented below. For the full set, please refer to the IES Cities Player.
Figure 1: Millenium Square in the center of Bristol.
Bristol Healthy Office
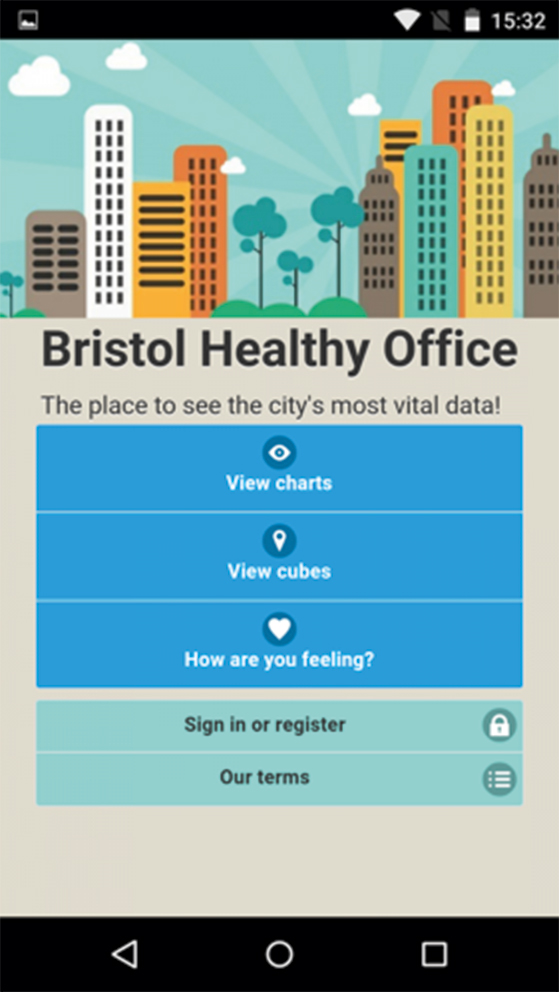
Figure 2: Screenshot of the Bristol Healthy Office app.
This service allows citizens to record and monitor environmental parameters of their working space. For offices with the required sensors, it visualizes data such as temperature, humidity, noise, light, and air quality. Healthy Office [Figure 2] allows people to gain insight into what affects the quality of their working space. Additionally, this app allows employees to record and monitor their own levels of work-related stress indicators, providing valuable insight into how people deal with the demands of their everyday working life. Finally, if the user has access to one of the personal monitoring devices, Healthy Office can optionally record and display personal health-related metrics, such as heart rate and temperature. All these combined sources of information through the app provide a valuable tool for monitoring and improving one’s working environment and conditions.
Rovereto Percorsi
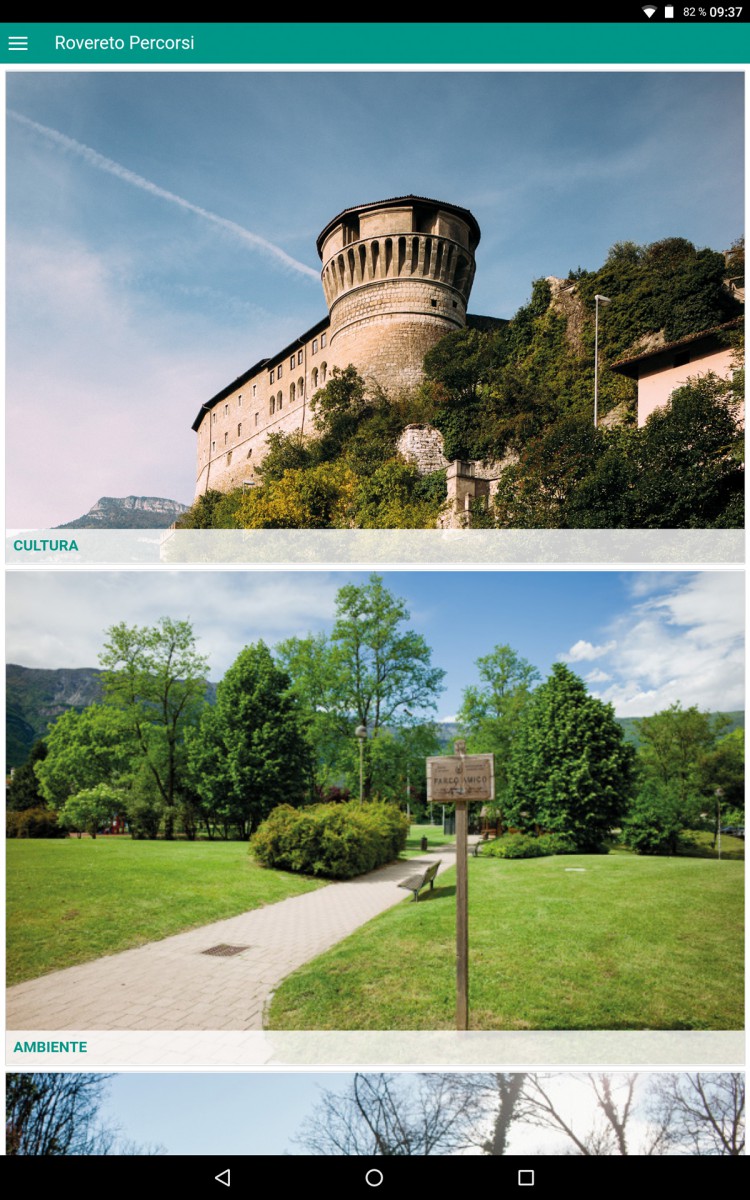
Figure 3: Screenshot of the Rovereto Percorsi app.
This service allows citizens and tourists to organize tours and visit the city of Rovereto by following user-provided itineraries with points of interest worth seeing [Figure 3]. Visitors may search for new tours by duration, type, length, and other characteristics. Itineraries present tours on a map, as well as a brief summary of the tour. Each way point may also provide a detailed description, including photos of points of interest (POI). Locals can contribute by creating their own tours or add descriptions of new POIs with their own content, such as photos and comments. A civil servant of the city council will validate the added content.
Zaragoza Voting
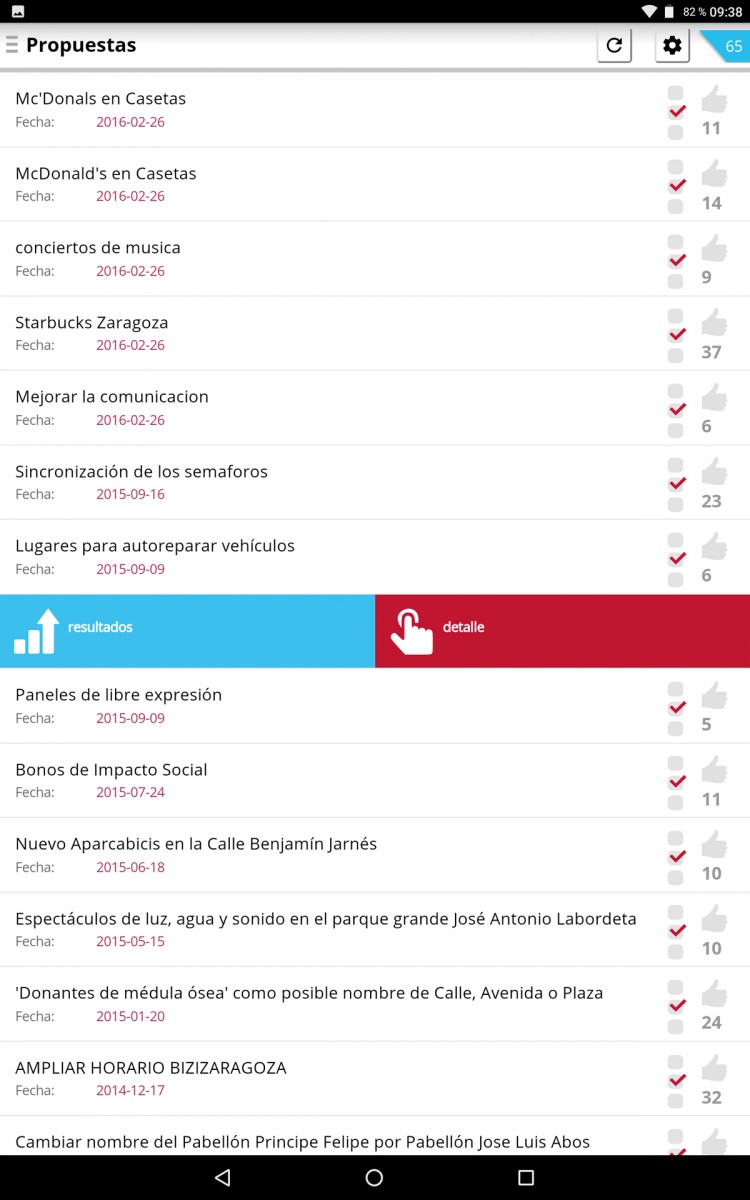
Figure 5: Screenshot of the Zaragoza Voting app.
Zaragoza Voting enables citizens to add and vote on proposals to improve their neighborhood [Figure 5]. It is intended to assist in the process of regeneration of a neighborhood in the city, namely the Delicias neighborhood of Zaragoza. Through their contributions and votes, citizens have the opportunity to participate and co-decide how they want their neighborhood to be. It is an application of digital democracy and citizens’ participation, which also meets a real social need. The app presents a list of all currently available polls and allows users who are logged on via a social network, for example, to cast a vote or create a new poll. Geo-referenced polls are also presented on a map.
Majadahonda Sports4U
Figure 6: Screenshot of the Majadahonda Sports4U app.
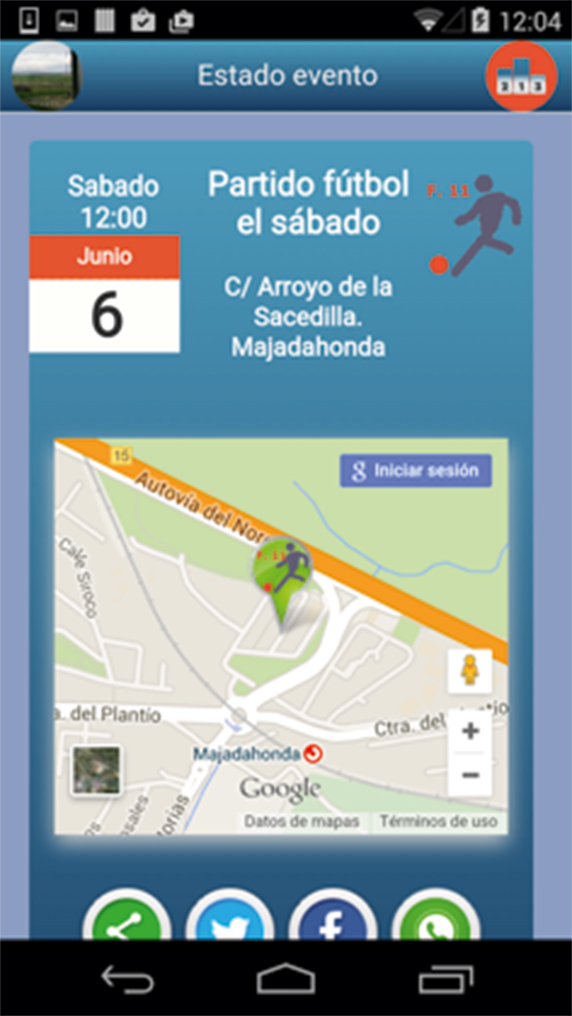
This service aims at increasing the dissemination of sports events organized by the city council and to foster the citizens’ participation in the sportive life of the city [Figure 6]. It will also allow citizens to meet and organize joint events to practice sports. The app provides Majadahondas citizens with accurate information about different sports events in the city (with schedules, matches, competition scores, happenings, etc.) and about the city’s sports facilities (with opening times, prices, availability, location, etc.). Registered users may also create groups of players in order to arrange matches with other players, to fix meetings, create leagues, etc. Majadahonda citizens will be able to search for events by different criteria such as the location on a map or the kind of sport they are interested in. Users can join events, add comments, add events to their own calendar, or share events on social networks. Citizens may also leave comments about the situation of the city facilities or questions related to practicing sports.

Figure 4: View of Zaragoza.
Architecture
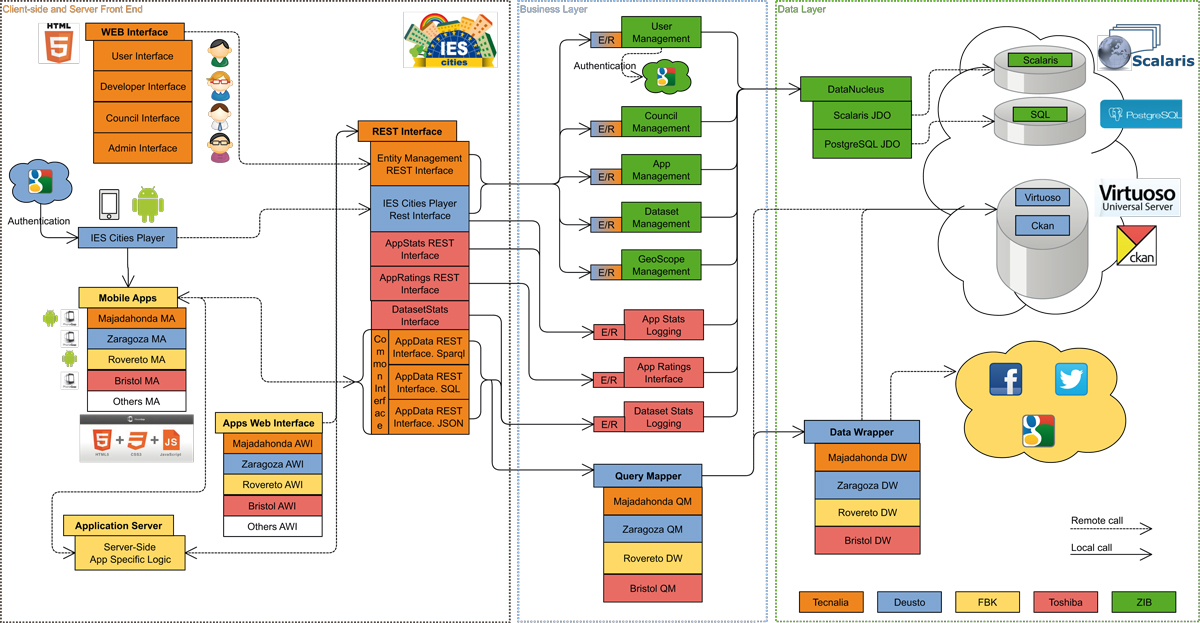
Figure 7: Software component architecture of the IES Cities platform.
Client-Side and Server Front End
Mobile apps and Web interfaces (HTML5/CSS3-based) are developed in order to exploit urban data accessible through the back-end RESTful interface [Figure 7]. Responsive mobile apps are generated with the help of Apache Cordova (PhoneGap). A Web front end allows applying CRUD (Create, Read, Update, Delete) operations to IES Cities’ main entities: users, councils, app metadata, datasets and geoscopes. This interface accounts for the different roles a user of the IES Cities platform may have: end users, application developers, city councils, and administrators.
A Jersey REST client is used for the apps to communicate with the IES Cities Framework’s RESTful interface. Aside from access to entity management, apps can also collect application and dataset statistics which can be analyzed in the Web interface. App-specific data storage, as well as access to the city councils’ datasets, external datasets and social media is provided by a common interface. Data queries for this functionality can be expressed in SPARQL, SQL, or JSON and are converted to the endpoint query format in the back end.
Server Back End (Business Layer and Data Layer)
The IES Cities server’s back end is split into two layers [Figure 7]: a pure data layer for access and storage, and the business layer with application logic. The data layer for entity management and app and dataset statistics logging are implemented with the generic persistence framework DataNucleus. The business layer builds upon this but does not need to know the specifics of the data storage. Therefore, the actual storage engine can be changed at any time, depending on current needs. Currently, two data storage drivers are provided: a stable PostgreSQL-based storage for everyday use, and a highly scalable NoSQL solution using Scalaris, which we will detail later on.
App-specific data as well as city council and external datasets are organized differently. The different datasets may be stored in different back ends with different APIs to access them. A Query Mapper translates app requests to data repository specific queries in SQL, JDOQL, SPARQL, or HTTP API calls with the help of the Data Wrapper, which gathers external data from social networks and Web pages. It adapts and stores this data to be accessible by the query mapper. Other dataset sources – open datasets offered by the city councils, for example – may be stored in Virtuoso or Ckan.
Creating Highly Scalable Database Back Ends
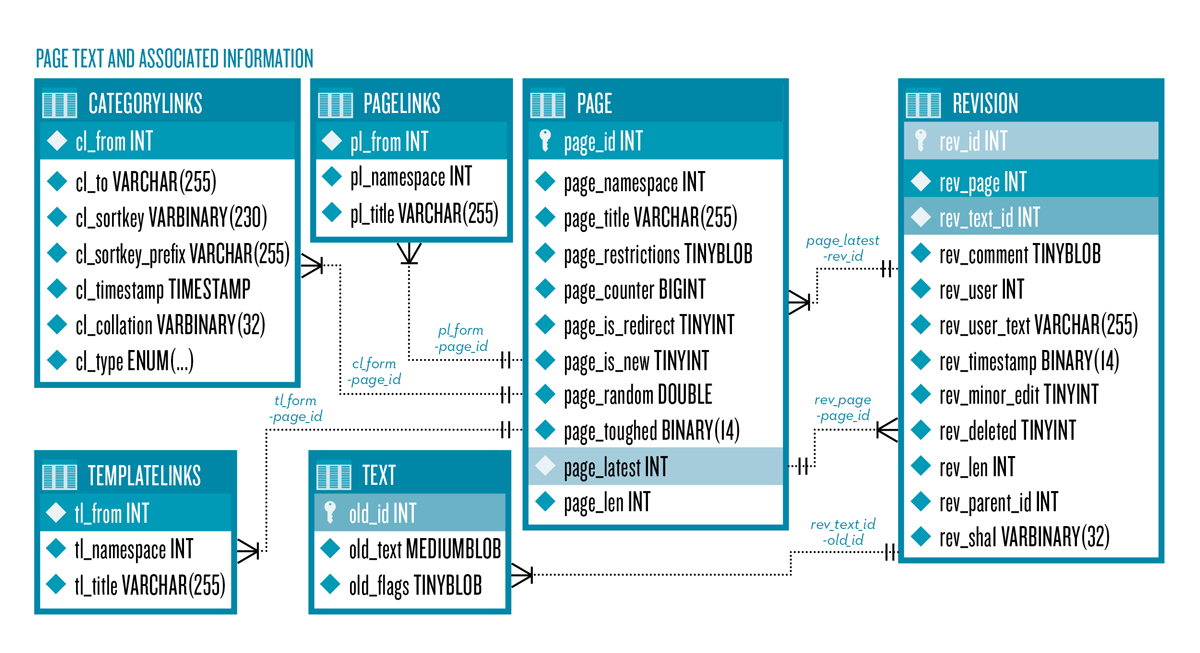
Figure 8: SQL example schema (excerpt from MediaWiki 1.20).
From SQL to NoSQL
Distributed key-value stores are horizontally scalable by design. However, most existing applications are developed with relational database schemes in mind, which generally do not scale horizontally in a cost-efficient way. These schemes represent objects and their relations, i.e. links between them. Even if an application is specifically designed for a scalable NoSQL data store, it is exactly these links (as well as indices of any kind) which can become hot spots or bottlenecks. These hot spots typically reduce the scalability of the key-value store and are especially prominent in cases where data needs to be modified. We have shown [1] that even the demanding Wikipedia database schema [Figure 8] can be mapped to the distributed transactional key-value store Scalaris. We show solutions for how to map dependent tables and secondary indices to a single key-value namespace and evaluate and identify hot spots and bottlenecks. These hot spots do not only arise from the aforementioned links between values, but also due to necessary work-arounds to cope with the limited expressibility of a typical key-value store.
In a scenario with many more read operations than writes, such as the Wikipedia scenario, we denormalize and create redundant values holding the metadata of all revisions of a page, for example, to avoid having to look up indirections between objects during reads. In the absence of multiple namespaces and more advanced query types, such as efficient search and aggregation operations, we explicitly materialize indices and create aggregate objects to avoid expensive table traversals.
With these techniques, most prominent hot spots arise from the representation of primary and secondary indices. The solution is to find suitable partitioning schemes for such indices, which depend on the access pattern on the specific indices. An index can be represented as a list where simple partitioning schemes spread items randomly –
or based on some hash function – into a number of sub-lists, i.e. the partitions. The overall size of a single partition is roughly the original size divided by the number of partitions. Since a partition’s size influences the amount of data transferred during write operations and thus the length of a transaction, we propose a more advanced partitioning scheme using separate read and delta buckets [Figure 9]. During normal operation, only the delta buckets are touched and include a log of modifications to the index. These changes are periodically merged back into the read buckets. This allows independent tuning of the partition size (via read buckets) and write concurrency (via delta buckets) and reduces the payload for write transactions.
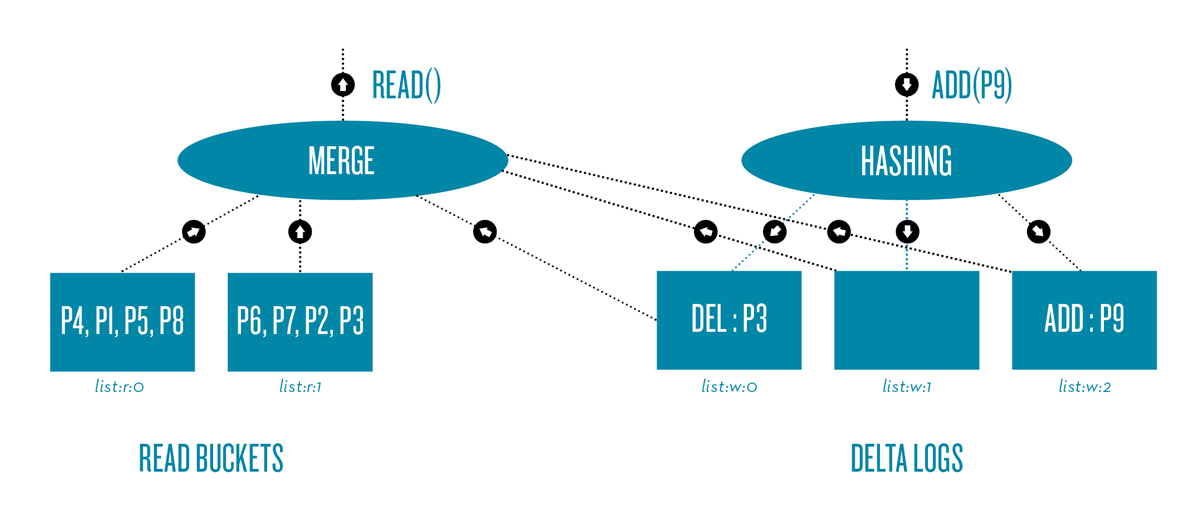
Figure 9: Hot spot partitioning with delta buckets.
Wiki Benchmark
(1 bench thread, 28 nodes)
The effects of using these partitioning schemes on a Wiki application deployed with a Scalaris back end can be seen in the plot shown in Figure 10. We imported the Spanish Wikipedia dump, with roughly 700,000 pages, and used a real HTTP query trace from Wikipedia as a benchmark for different kinds of operations. In a single-threaded scenario, we can see the huge impact of partitioning schemes on the execution times of write operations. In a more concurrent scenario, we also show that these schemes do not only improve the execution times of write operations, but also considerably improve the read operations’ speed due to the reduced network bandwidth used by the (very few) write operations (FN:N. Kruber, F. Schintke, M. Berlin. A relational database schema on the transactional key-value store Scalaris. 2nd Workshop on Scalable Cloud Data Management, 2014.). This even holds for the typical back-end scenario where 95% of the read requests hit HTTP caches only. In the remaining requests, only 2.5% and 0.3% are edit and create operations, respectively.
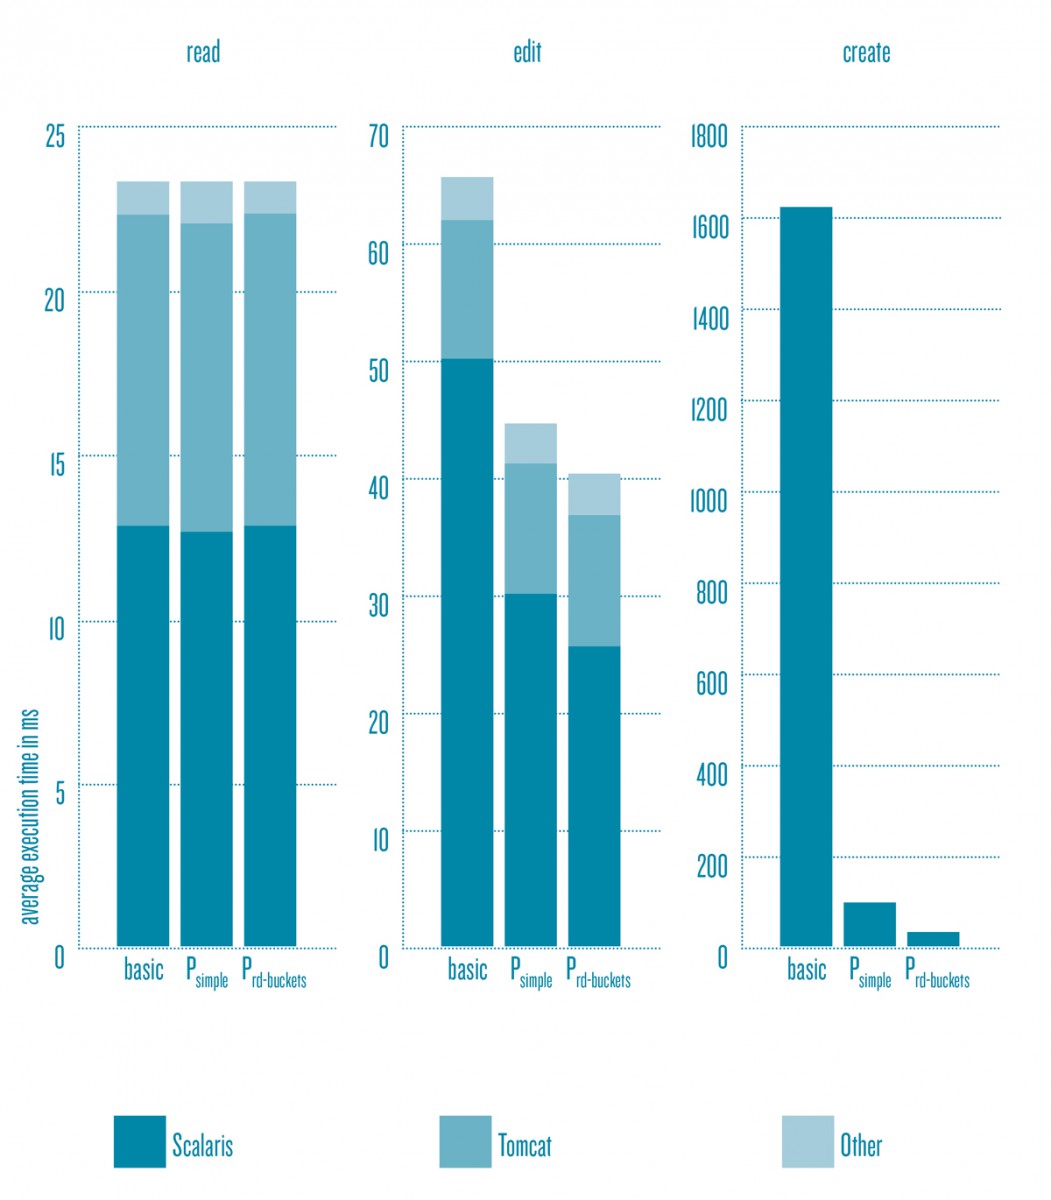
Figure 10: Benchmark results for the read, edit, and create operations with different data layouts of the Wiki on Scalaris.
Efficient Repair Mechanisms
A distributed key-value store such as Scalaris may use replicated values to increase the reliability of stored data. In order to prevent faults, these systems need to have a mechanism to repair the replicated values in cases of node or network failures. Therefore, we need to compare the sets of two nodes’ stored items by using at least an item’s key and some version information associated with it. There is a number of set reconciliation algorithms to solve this task, both exact as well as approximate algorithms, with the latter promising lower transfer costs. The comparison of different approximate algorithms for distributed replica repair, however, is challenging. Each algorithm’s behavior can be tuned for a given use case, such as low bandwidth or low computational overhead using different sets of parameters. These parameters often also influence the algorithm’s accuracy in detecting differences between replicas and thus hinder objective comparisons.
In (FN:N. Kruber, M. Lange, F. Schintke. Approximate Hash-Based Set Reconciliation for Distributed Replica Repair. IEEE 34th International Symposium on Reliable Distributed Systems, 2015.), we develop models to deduce parameters for equally accurate (approximate) set reconciliation algorithms for replica repair in distributed systems. We compare equally accurate instances of two trivial hash-based algorithms, an algorithm using Bloom filters (FN:B. H. Bloom. Space/Time Trade-offs in Hash Coding with Allowable Errors. Communications of the ACM. 13.7:422–426, 1970), and a newly developed approximate “Merkle-tree-based algorithm (FN:R. C. Merkle. A Certified Digital Signature. Advances in Cryptology — CRYPTO ’89 Proceedings. 435:218–238, 1990.)” outlined in Figure 11 and described below.
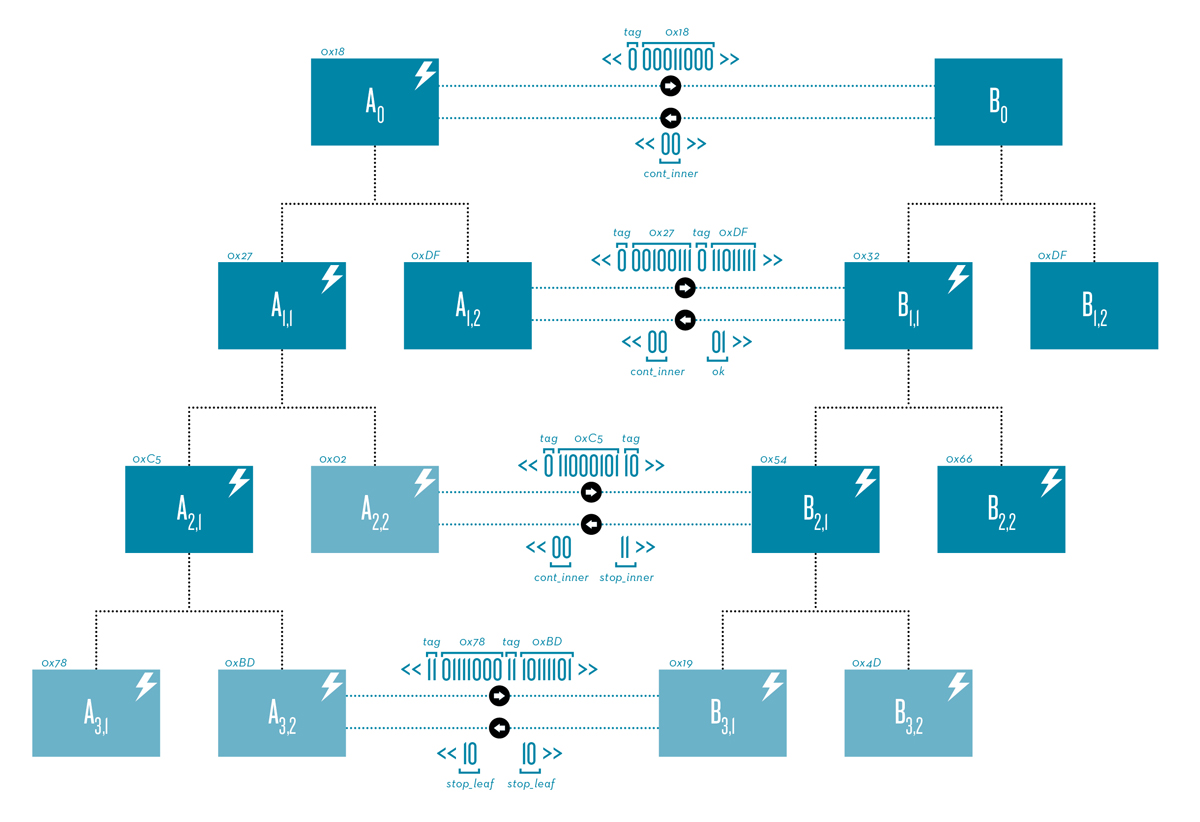
Figure 11: Merkle tree synchronization.
In a Merkle tree, every inner node is labeled with the hash of the labels of its children and every leaf node is labeled with the hash of the data it represents, i.e. one or more items. This allows an effective recursive top-down comparison between two distributed trees. Instead of using a large fixed hash size for the nodes’ labels, however, we use dynamic hash sizes to align the transfer overhead with the desired accuracy. To compare two nodes’ item sets in a common synchronization interval I, we build a Merkle tree of degree v and bucket size b on each node using the key-version information of each stored data item. This is done recursively until the number of items is less than or equal to b. Finally, the hashes are created bottom-up. During synchronization, one node sends tagged Merkle tree node hashes to the other node which responds with result codes indicating hash matches (identical items below this tree) or mismatches (continue down to the next level) until no further mismatches occur [Figure 11]. As a result, this optimized Merkle tree reconciliation protocol is not only more efficient for a very low number of differences (as is usually the case), but also has lower transfer costs for differences up to 50% [2]. This is considerably higher than the 5.0% differences for which the original Merkle tree reconciliation was previously thought to still be efficient. The plot in Figure 12 shows how the four analyzed algorithms perform comparing two nodes’ item sets in two scenarios: “update” with outdated items (left column) and “regen” with items lost on both nodes (right column). The two metrics shown in the upper two rows verify the configured accuracy differentiated by the number of items not found in the reconciliation and the redundantly transferred items where the algorithm suspected a difference, but there was none. RC costs reflect the transfer costs during different phases of the algorithm. It clearly shows the advantages of an adaptive algorithm like the Merkle tree. Note, however, that Merkle reconciliation is a multi-round algorithm bound by network latencies.
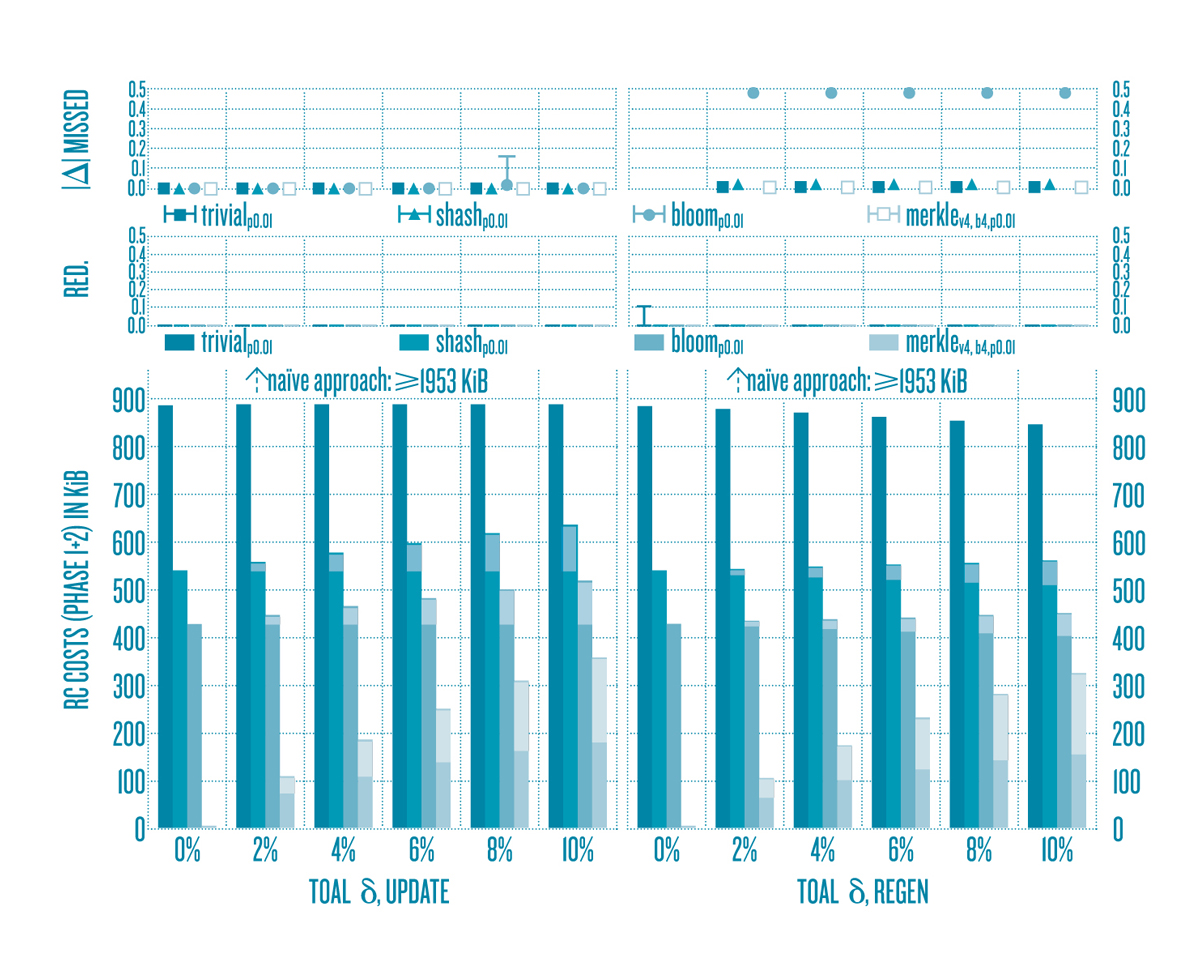
Figure 11: Performance comparision of different synchronization algorithms.


