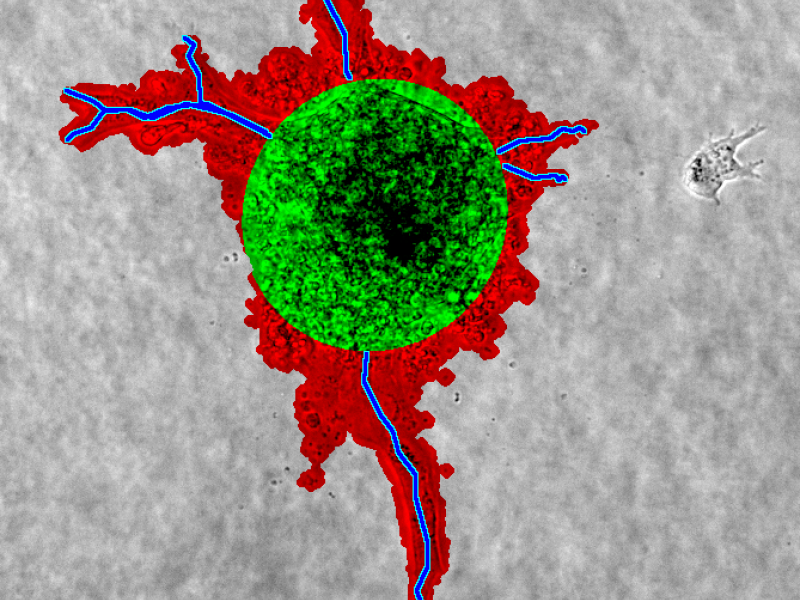
Angiogenesis, the formation of blood vessels, plays an important role in the regeneration of bone fractures and wound healing. To study the mechanisms behind angiogenesis, the blood vessel growth can be assessed in vitro by measuring the size of spheroids and the number and length of sprouts that form after seeding endothelial cells in a cell culture. The quantification of such spheroid sprouting assays is often performed manually based on bright-field microscopy images. However, measuring the sprouting behavior manually is time-consuming and often results in highly subjective outcomes, since the image data shows a low-contrast between sprouts and the background. The goal of this project is to develop image segmentation and classification methods that instead allow for a fully automatic quantification of angiogenesis assays, eliminating the need for manual classification and thus increasing the quantification throughput and the reproducibility of the assays.

Process of Angiogenesis. Images by Andreas Benn, FU Berlin, 2014
Spheroid Sprouting Assays
Endothelial cells seeded onto a gel matrix condense to a spheroid. Based on bright-field microscopy, the growth of spheroid extensions, so called sprouts, is assessed by measuring the following quantities:
- Area occupied by spheroid
- Area occupied by sprouts
- Length and number of sprouts
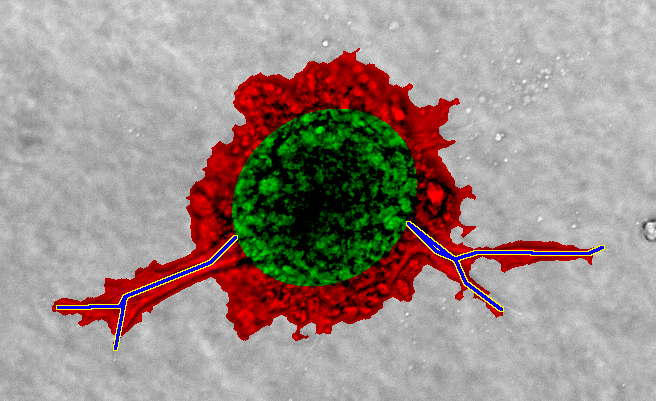
A quantification of a spheroid sprouting assay. Red is the sproutarea, green the spheroid, and blue with yellow outline the sprouts.
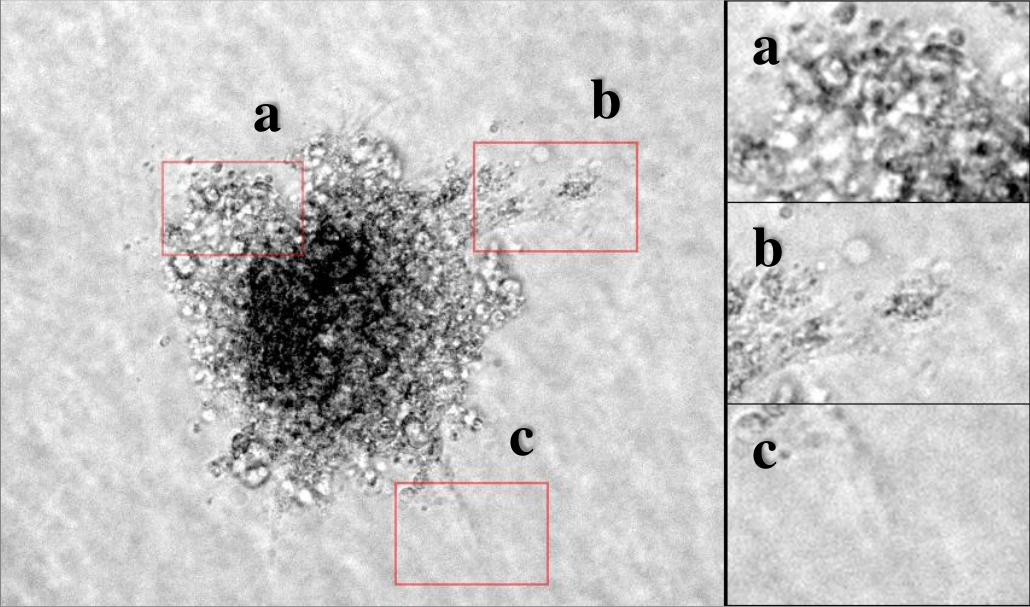
Image of a spheroid sprouting assay (left) with magnifications of highlighted regions (right). Challenges include: (a) Inhomogeneous sprout area, (b) low contrast between sprout and background, (c) inhomogeneous background.
Automated Quantification Pipeline
Our goal is to quantify the growth of sprouts depicted in a bright-field microscopy image. We segment the input image using the mPb contour detector (Arbelaez et al., 2011) and then perform a skeletonization (Zhang and Suen, 1984), from which the sprouts are derived.
The spheroid area is detected using a Markov Random Field texture classifier (Varma and Zisserman, 2003).

Angiogenesis Pipeline. Left: Input bright-field microscopy image. Top left: Contour detection, top middle: Threshold segmentation, top right: Skeletonization. Bottom left: Texture Classification, bottom middle: Region selection, bottom right: Ellipse Fitting. Right: Output segmentation/quantification. Green: Spheroid Area, red: Sprouting area, blue/yellow: Sprouts
Results
In a preliminary evaluation, we compared the classification output of the newly developed image processing pipeline to a manual classification. A large-scale comparative study is subject to future work.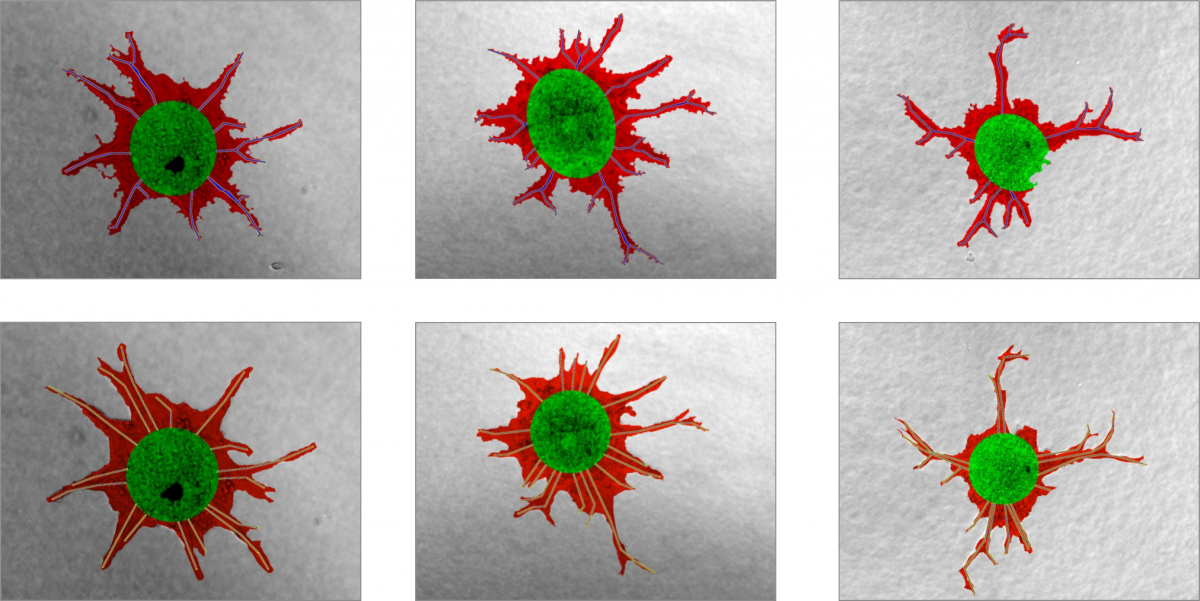
Automated classification on top, manual classification on bottom. Green: Spheroid area, red: Sprouting area, blue/yellow: Sprouts.
Future Applications
Our future goal is to taylor the presented image pipeline to other assay types and optical microscopy modalities, for example:
- Spheroid sprouting assays based on fluorescence microscopy
- Tube assays (determine length of tubes and number of branching points)
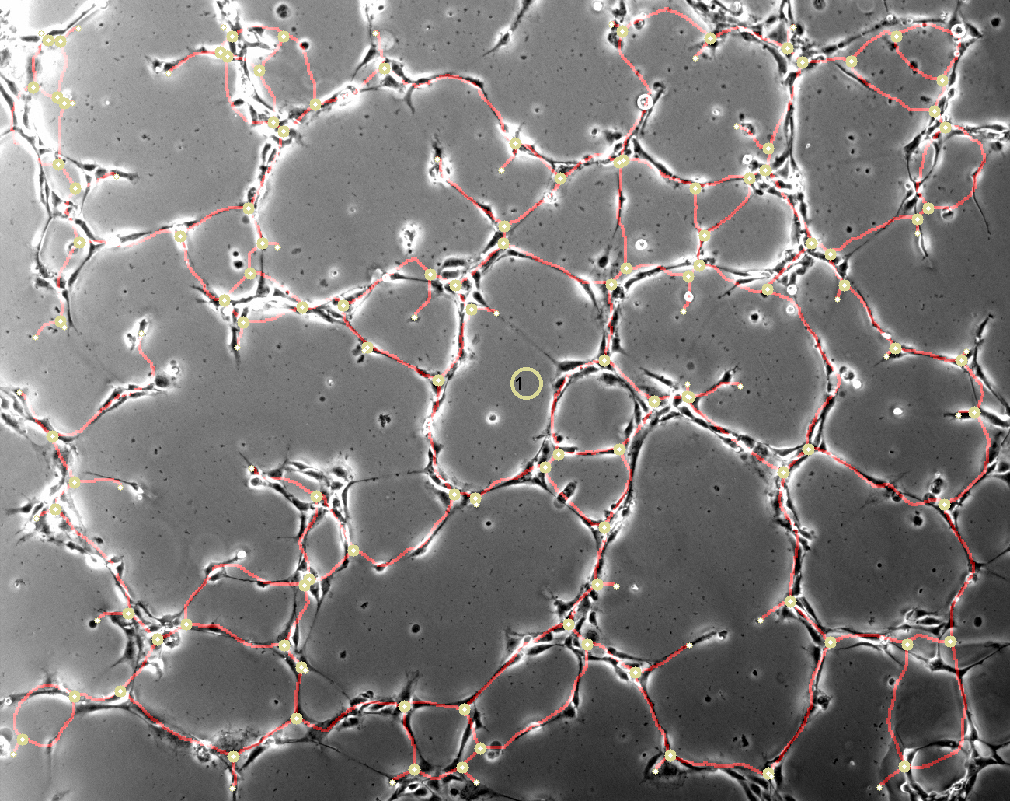
Classified Tube Assay. Image by Andreas Benn, FU Berlin, 2014
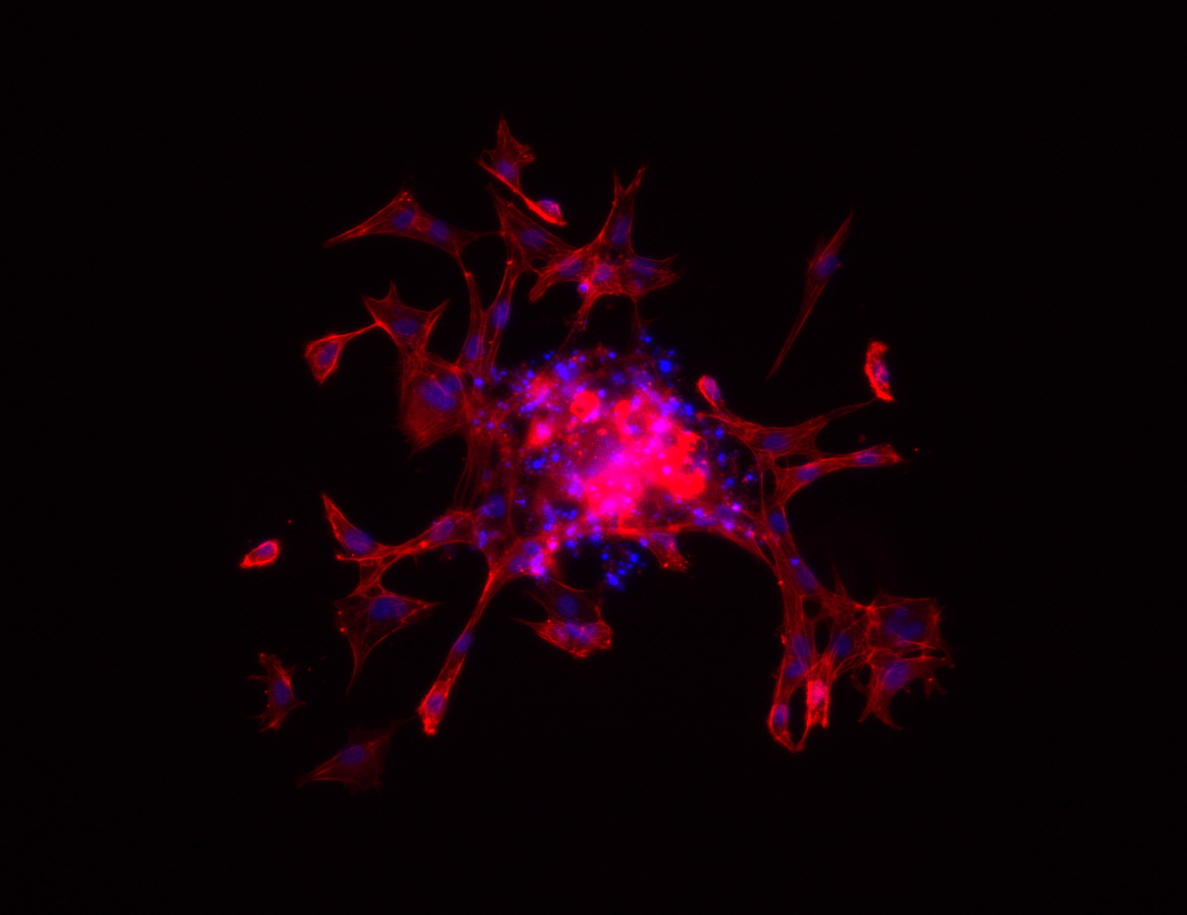
Spheroid Sprouting Assay with Fluorescent Staining. Image by Andreas Benn, FU Berlin, 2014
References
Arbelaez, P., Maire, M., Fowlkes, C., & Malik, J. (2011). Contour detection and hierarchical image segmentation. Pattern Analysis and Machine Intelligence, IEEE Transactions on, 33(5), 898-916.
Varma, M., & Zisserman, A. (2003, June). Texture classification: Are filter banks necessary?. In Computer vision and pattern recognition, 2003. Proceedings. 2003 IEEE computer society conference on (Vol. 2, pp. II-691). IEEE.
Zhang, T. Y., & Suen, C. Y. (1984). A fast parallel algorithm for thinning digital patterns. Communications of the ACM, 27(3), 236-239.
