Bone
Image Based Bone Analysis
Members
Christian Hege
Gisela Beller
Wolfgang Gowin
Jürgen Kurths
Norbert Marwan
Steffen Prohaska
Peter Saparin
Jesper Skovhus Thomsen
Links
Note Bone FEA
bone3d.zib.de
www.zib.de
| Image Based Bone Analysis | |||||
| Osteoporosis is a disease in which bones become fragile and more likely to break. The goal of this project is to develop Tools which enable users to analyze µ-CTs of bone biopsies. One focus is the development of new structural measures together with the cooperation partners. Another point is to enable the user to visualize their data interactively. | |||||
|
Introduction | |||||
|
Osteoporosis is a disease in which bones become fragile and more likely to break. If not prevented or if left untreated, boneporosis can progress painlessly until a bone breaks. These broken bones,also known as fractures, occur typically in the hip, spine, and wrist. In Europe, this disease affects about 30% of the women and 6 per cent of the men over 50 years of age. The main risk factors are genetic, hormonal and related to sedentary way of life with a lack of physical activity. Due to the absence of gravity constraints on the body, astronauts can lose up to one per cent of their bone mineral density each month. The bone loss observed after a space flight of a few months corresponds to that of several years on ground. For boneporosis, astronauts could therefore be considered as "hyper-sedentary" persons. An important task in research projects and in diagnosis is to assess the quality of the bone. X-ray micro-computer-tomography is an ideal method for the non-destructive analysis of the microstructure of bone or other materials. Recent technical advances allow for spatial resolution of 5 microns in almost any material at reasonable costs. Tools will be developed in the project that enable users to analyze microCTs of bone biopsies. One focus is the development of new structural measures together with the cooperation partners. Another point is to enable the user to visualize the data interactively. Due to the complex structure of trabecular bone this is not an easy task. |
|||||
|
Analyzing Structure | |||||
|
A typical workflow during analysis of an image of a bone biopsy consists of several steps:
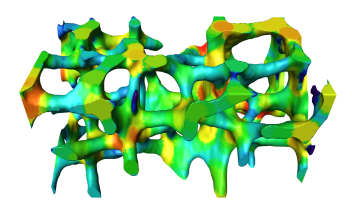
Some or all of these steps might be included in the scanner software as a predefined analysis pipeline. For a defined clinically established application, the integration with the scanner hardware might be an advantage. However, it might be useful to have more influences on these steps in medical research and adapt them to the specific needs. We develop a bone quantification framework which is based on the general purpose visualization software Amira. Standard 3D measures are available for quantification of the biopsies (BV/TV, Conn. D., Tb.Th, Tb.Sp, DA), however the main focus is to provide the possibility to develop own algorithms for quantitative bone biopsy assessment. We used the framework to extend 2D measures of complexity to 3D. Visualization techniques facilitate this process. They are useful to understand every step in detail which helps finding problems and errors. Visualization local quantities as e.g. the local thickness (see image below) are also helpful.
|
|||||
|
Fast Visualization | |||||
|
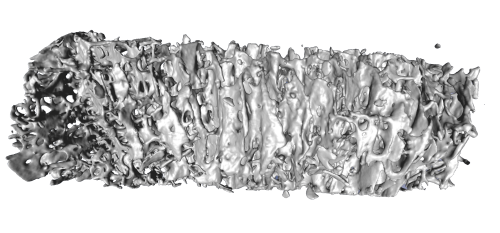
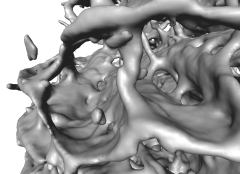
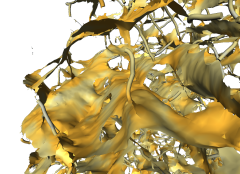
A high resolution µ-CT scanner produces huge amounts of data. Isosurface representations and volume rendering are standard techniques. However, for data with rich internal structure, like the bone structure, these methods are not always well suited (see Fig. below). Isosurfaces are likely to consist of several millions of triangles and cannot be rendered interactively using standard techniques. Even if rendering performance is not a problem, the structure might be visually too complex to be depicted as an isosurface. Structures near the view point occlude those farther away and prevent to properly visualize the internal composition of the object.
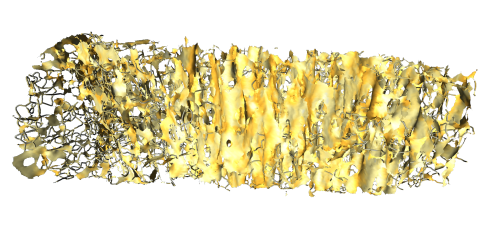
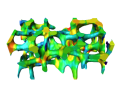
This suggests to start with a shape analysis procedure, creating a representation of the object that is better suited for visualizing its internal structure and that may serve also as starting point for geometrical and topological analysis. We developed an algorithm which extracts parts of the medial surface from a binary 3D image representation of an object. This algorithm is based on a measure which is sensitive to plane-like structures. It does not preserve the topology of the original object. If needed, homotopy with the original object can be reconstructed in a second step. The plane-like parts of the resulting voxel skeleton are triangulated for fast rendering. The rod-like parts are rendered as lines. The triangulation method creates surfaces not enclosing a volume. Practical experience shows that these surfaces can also be easily simplified. They tend to better preserve the original geometrical structure than isosurfaces, even with a low triangle count (see figure below). The paper Fast Visualization of Plane-Like Structures in Voxel Data describes this in more detail.
|
|||||