TIME SERIES SIMILARITY
Time series are recorded from sensors and other input sources over time. Application domains include personalized medicine, human walking motions, anthropology, security, historical documents, astronomy, or spectrographs. For data analysis, the input data must be cleaned by eliminating erroneous, extraneous, and repetitive substructures. The signals from Electrocardiography (ECG) recordings, for example, are highly redundant and they may contain noisy or extraneous data before or after the sensor was connected to the patient.

Electrocardiography (ECG).
While a human has an intuitive understanding of the similarity of objects, this task becomes very complex for a computer. A similarity measure is commonly used to compare two time series which qualifies similar objects by a small number and dissimilar objects by a large number. The most simple similarity measures include the Euclidean Distance (ED) or Dynamic Time Warping (DTW). Despite the fact that DTW is several decades old, it has shown to be highly competitive and is up to date used as a benchmark. ED and DTW have some known short comings. The former fails to match time series if they contain reordered substructures, like heart beats in an ECG recorded in a different ordering. The latter provides a peak-to-peak and valley-to-valley alignment of two time series, which fails if there are a variable number of peaks and valleys, e.g. a different number of heart beats in an ECG recording.
A toy example contains three basic shapes: bells, cylinders and funnels, whereas each shape is distorted by noise, see Fig. 2.
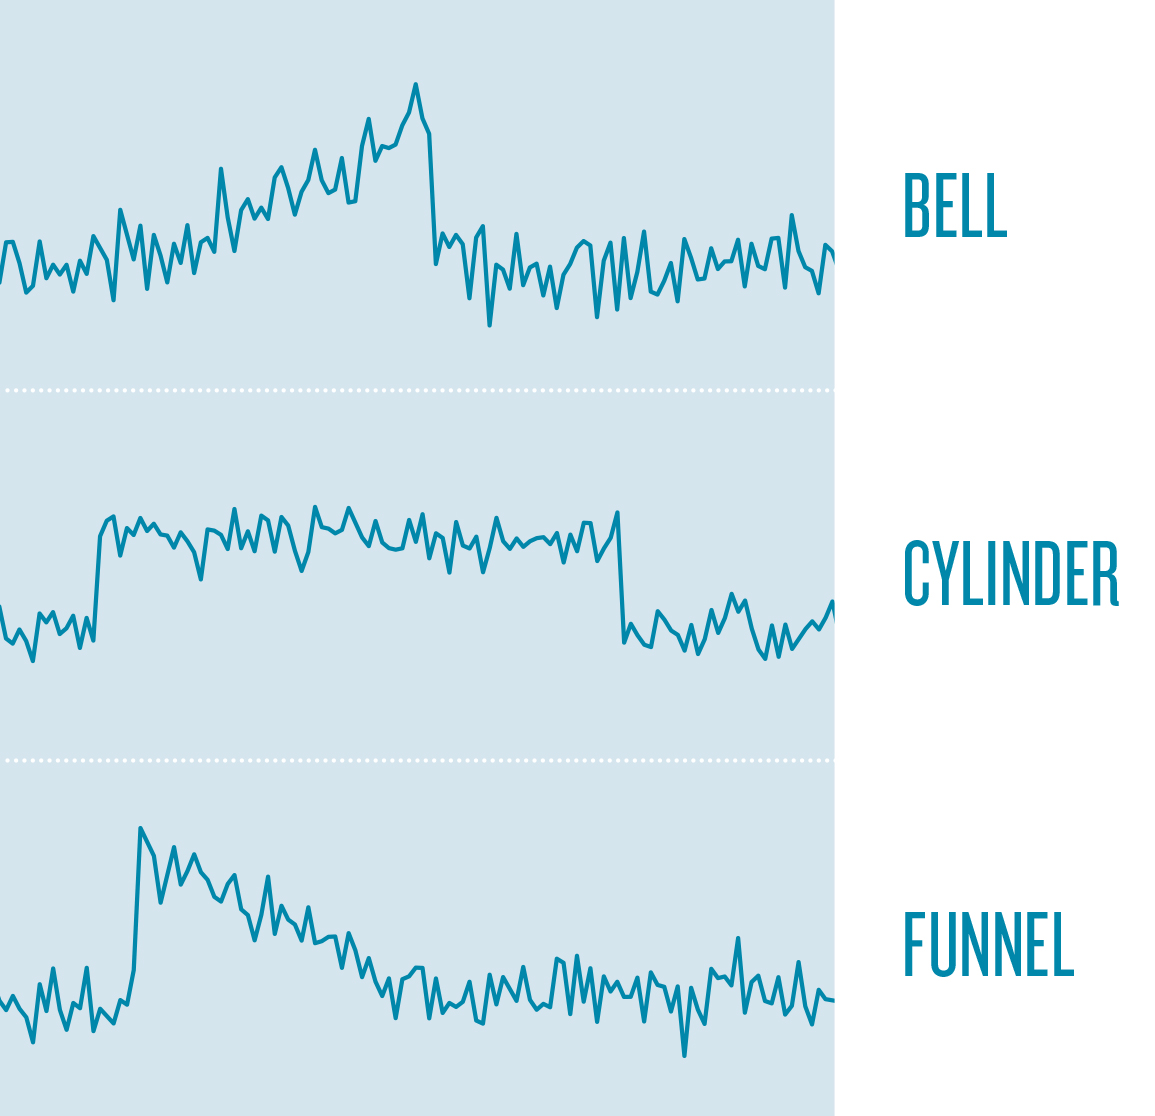
Basic shapes of curves.
For the human eye it is easy to distinguish between these curve types. Given a large number of these shapes both ED and DTW fail to capture the dissimilarity of the bell and funnel curves correctly. This toy example gives an impression on the difficulties that may arise with respect to time series similarity. In general, several sources of invariance like amplitude/offset, warping, uniform scaling, occlusion, and complexity have been presented. The three shapes require invariance to phase (horizontal alignment), warping (local scaling), occlusion (noise) and amplitude/offset. State-of-the-art algorithms that provide subsets of these invariances are based on structure-based similarity. That is two time series are compared based on their higher level structures like reoccurring or characteristic patterns.
Interestingly, while structure-based similarity measures provide very good results on some datasets, they are not more accurate than DTW in general. We believe that one reason for this is that invariance to noise was paid little attention to and the similarity is often estimated based on raw and noisy time series data.
FROM REAL VALUES TO WORDS
Our Symbolic Fourier Approximation (SFA) is a symbolic representation of time series. SFA is composed of two operations, namely low pass filtering and quantization. These aim at reducing noise from a time series.
CASE STUDIES USING SFA
SFA was applied in the context of:
- Time series similarity search (FN:P. Schäfer, M. Högqvist {2012}. SFA: a symbolic Fourier approximation and index for similarity search in high dimensional datasets. EDBT Proceedings of the 15th International Conference on Extending Database Technology, pp. 516-527.),
- Time series classification (FN:P. Schäfer {2014}. Towards Time Series Classification without Human Preprocessing, Machine Learning and Data Mining in Pattern Recognition: 10th International Conference, MLDM 2014, St. Peterburg, Russia.),
- Insects wing-beat classification (FN:P. Schäfer, S. Dreßler {2013}. Shooting Audio Recordings of Insects with SFA, AmiBio Workshop, Bonn, Germany.), (FN:I. Potamitis, P. Schäfer {2014}. On Classyfing Insects from their Wing-Beat: New Results, Symposium on “Ecology and Accoustics: Emergent Properties from Community to Landscape”, Paris, France.).
SFA is a symbolic representation. That is, the SFA transformation of a real valued time series results in a lower dimensional character string, named SFA word, using an alphabet of symbols. The figure 1 top represents the wing-flapping of a mosquito. These were recorded by a sensor that measures the fluctuations of light received by a photoreceptor as an insect flies through a laser beam and partially occludes light with its flapping. The main source of misclassifications results almost completely from species that are very similar in size and morphology: aedes aegypti (yellow fever mosquito) male can be misclassified to culex tarsalis (mosquito) male but never as Apis mellifera (common bee), which is a much larger insect compared to mosquitoes. Figure 1 center illustrates the SFA words over the subsequences of a time series. Figure 1 bottom gives an impression of the inverse transformation of an SFA word which represents an area. In the context of insect classification SFA smoothens out anatomic differences of animals of the same species or other sources of misclassification like different entrance angles or speed of the insect when passing the photoreceptor.
In general SFA has two parameters: the size of the alphabet and the word length. These have the following effects:
- Low pass filtering: Rapidly changing sections of a time series are often associated with noise. This can be reduced by a low pass filter. The SFA word length determines the bandwidth of the low pass filter.
- String representation: SFA makes use of quantization and character strings. Thereby it allows for string matching algorithms to be applied. The size of the alphabet determines the degree of quantization, which has an additional noise reducing effect.
SFA is composed of two operations:
1. Approximation using the Discrete Fourier Transform (DFT).
2. Quantization using a technique called Multiple Coefficient Binning (MCB).
Approximation aims at representing a signal by a transformed signal of reduced length. Higher order Fourier coefficients represent rapid changes like dropouts or noise in a time series. This time series is low pass filtered by using only the first few Fourier coefficients. Quantization adds to the noise reduction by dividing the frequency domain into frequency ranges and mapping each real valued Fourier coefficient to its range. Our quantization scheme MCB is data adaptive and thereby minimizes the loss of information introduced by the quantization.
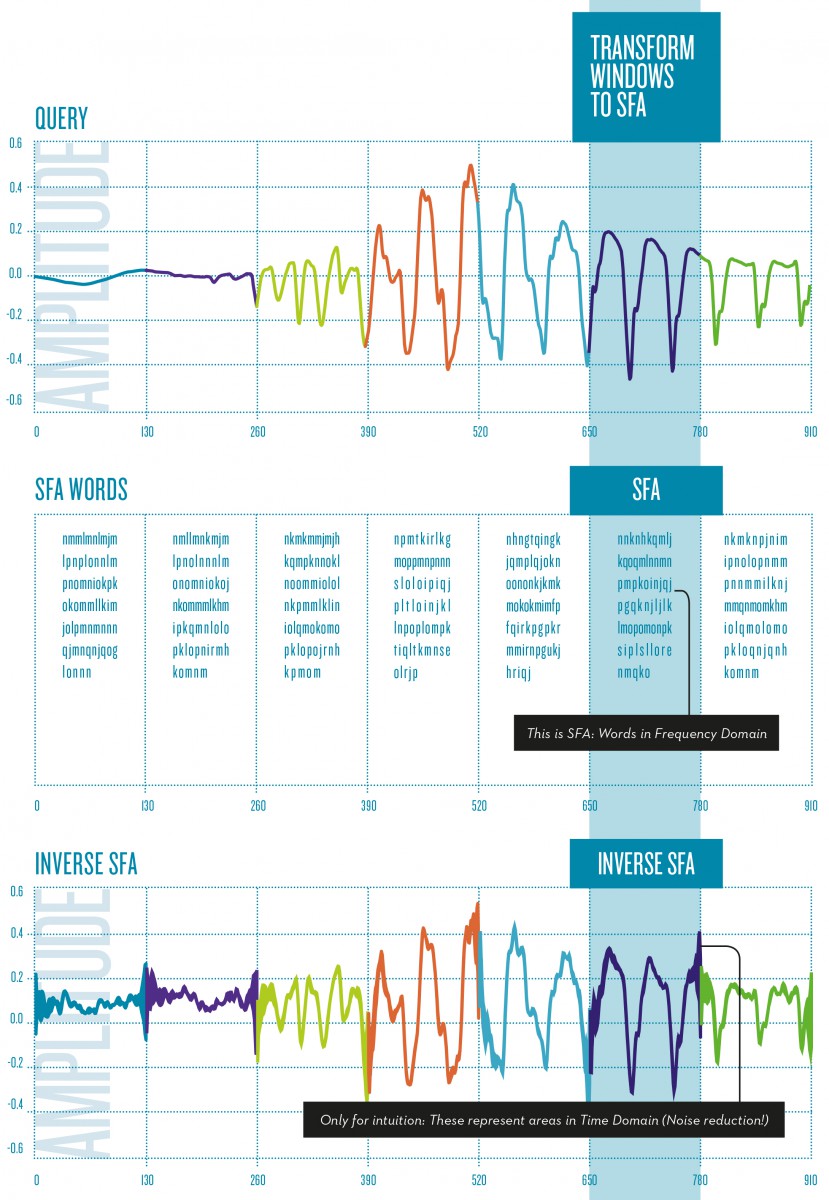
The query (top) is cut into windows, and an SFA representation (bottom) is calculated using an alphabet of size 26 (»a« to »z«).
TIME SERIES SIMILARITY SEARCH
A problem of time series similarity search is that the amount of data can be massive. For example, 1 hour of an ECG log sums up to 1 GB, or the sensors of a space shuttle record up to 200GB for each start. To avoid sequentially scanning the data for each query, an index structure must be used. A time series consisting of n measured values can be seen as a point in n-dimensional space, where the i-th measured value represents the i-th dimension. By indexing this n-dimensional point using a spatial index, the problem of finding similar time series is reduced to finding nearby points in n-dimensional space using a similarity metric as introduced before.
Indexing high dimensional data is a considerable challenge, as spatial index structures, like the R-Tree suffer from a phenomenon called the Curse of Dimensionality: with increasing dimensionality of the search space, the performance of similarity based queries on the index becomes worse than a linear scan of all data. Spatial index structures usually degenerate with 10-20 dimensions.
By using dimensionality reduction prior to indexing and a lower bounding distance measure, queries are guaranteed to return the exact same result in reduced dimensional search space as if they were executed in the original space. In order to reduce the dimensionality of a time series an approximation technique is applied, effectively reducing dimensionality of the time series by 10:1 to 50:1. By use of an approximation technique the Curse of Dimensionality is shifted to 10-20 indexable dimensions of the approximations. The problem with approximation is that information from the original time series is lost. A goal of approximation is to find representations of the original data, so that each representation is distinct. For example, similar time series will have the same representation after an approximation if the reduced dimensionality is too low.
AN INDEX STRUCTURE FOR TIME SERIES
The purpose of indexing is to partition the search space into equal-sized groups containing similar entries and to provide a fast lookup for these entries. The idea of indexing SFA is simple: grouping is done based on the first k characters of the SFA words. Increasing k leads to smaller sized groups. As the entries are not equally distributed in the search space, k is individually increased until all entries are equally distributed over each group. This means that SFA is best computed at a high word length, but only a few groups exploit all symbols of the words.
In essence, our SFA try is a prefix tree built over the prefixes of the SFA words of the time series. In the SFA trie, each node represents all time series sharing the same prefix of an SFA word. The novelty of the SFA trie is that it adapts to dense leaf nodes by increasing the length of the prefix, which equates to improving the quality of the approximation without altering all the other leaf nodes. This increases accuracy of the similarity search, i.e. less leaf nodes have to be searched for answering a similarity query.
SFA in combination with the SFA trie build an exact method for time series similarity search. They offer a very low memory footprint due to quantization applied on top of approximation. By utilizing our variable length symbolic representation, we were able to index and search terabyte sized time series datasets with commodity hardware.
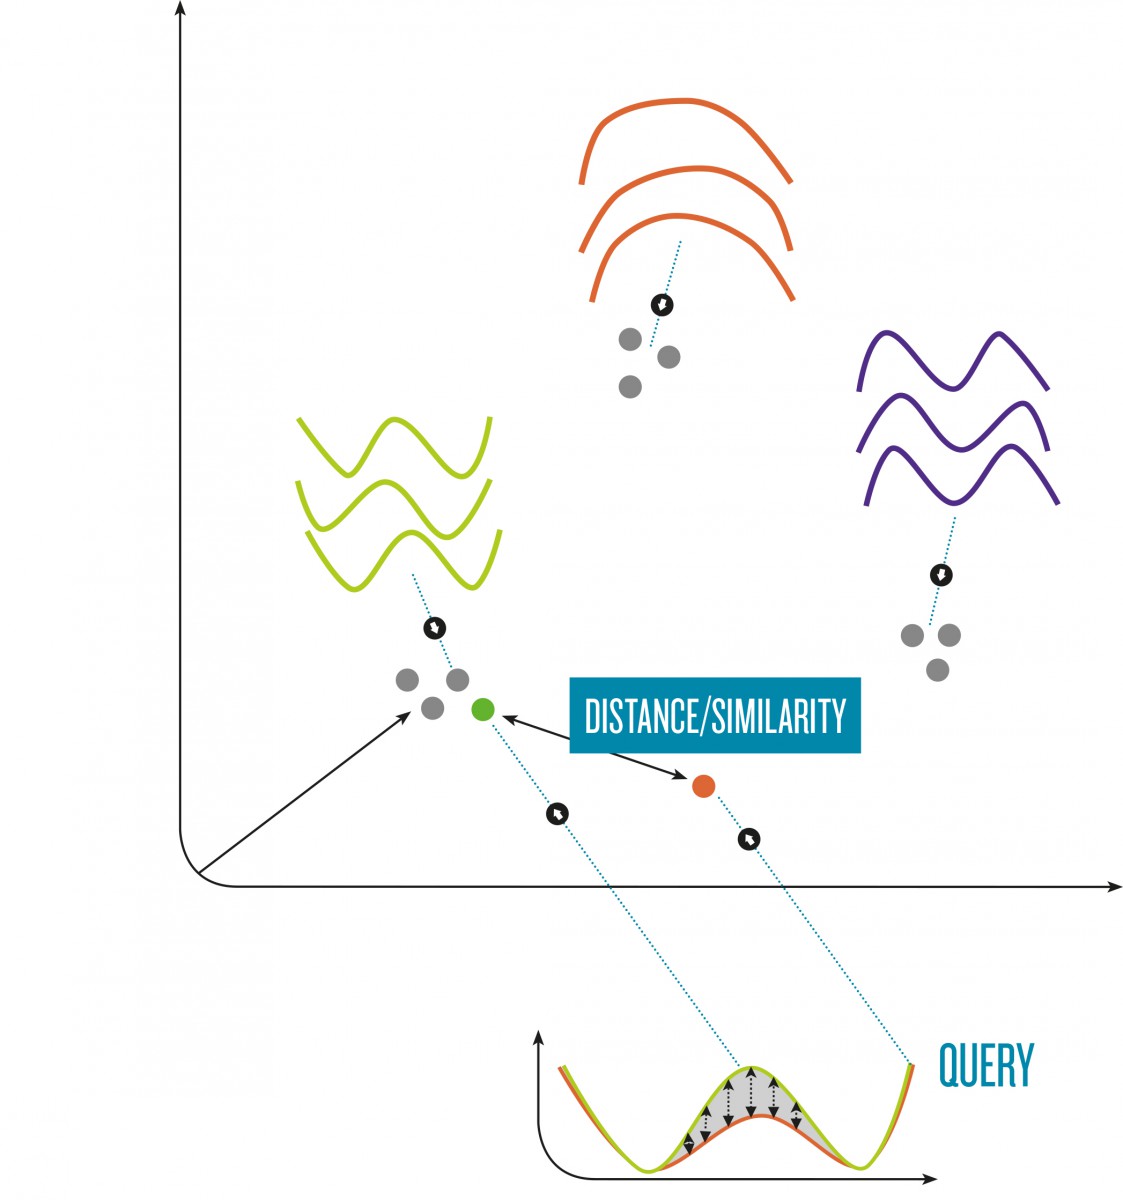
The similarity of time series corresponds to closeness of points in n-dimensional space.
TIME SERIES CLASSIFICATION
Designing a time series classification algorithm is a challenging task. It is non-trivial to extract a statistical model from time series as these may be non-stationary, and show varying statistical properties with time. Data mining algorithms, on the other hand, degenerate due to the high dimensionality of the time series and noise. Existing techniques for time series classification can be categorized into shape-based and structure-based. Shape-based techniques use a similarity measure in combination with 1-nearest-neighbor search. These are very competitive on cleaned datasets but fail on long or noisy data. Structure-based techniques transform a time series into a different representation or extract characteristic features from the time series like reoccurring, characteristic patterns. This comes at a higher computational cost when compared to shape-based approaches.
We looked at case studies covering human walking motions, personalized medicine, anthropology, historical documents, mass spectrography and security. Let’s have a closer look at walking motions of four different subjects. Each motion was categorized by the labels normal walk and abnormal walk. The data were captured by recording the z-axis accelerometer values of either the right or the left toe. The difficulties in this dataset result from variable-length gait cycles, gait styles and pace due to different subjects throughout different activities including stops and turns.
Approaches based on similarity measures like the Euclidean Distance or Dynamic Time Warping fail to identify the abnormal walking styles. Our Bag-of-SFA-Symbols (BOSS) model combines the extraction of substructures with the tolerance to extraneous and erroneous data using the noise reducing SFA representation of the time series. The similarity of two time series is then estimated based on the differences in the set of noise reduced patterns. As a result the separation of the normal walking motions from the abnormal walking motions is much clearer with just one walking motion being misclassified. As opposed to rivaling methods our approach offers multiple advantages: (a) it is robust to noise, (b) it allows for fast data analytics by use of string matching algorithms, (c) it is more accurate than state of the art time series classifiers, and (d) it provides invariance to the phase shifts, offsets and amplitudes and occlusions by comparing two time series based on their higher-level substructures.

Human walking motions are recorded by an accelerometer.
ON CLASSIFYING INSECTS FROM THEIR WING-BEAT
Producers set up traps in the field that lure and capture pests, in order to detect and count them. Manual inspection of traps is a procedure that is both costly and error prone. Inspection must be carried out manually as a repeated process, sometimes in areas that are not easily accessible. These traps can also, and often do, accidentally capture other species of insects rendering the counting difficult especially for species that are morphologically similar. Pest surveillance, adaptable for other flying insect pests, can provide pest information at regional and national scales, giving authorities a powerful tool to understand at a higher level the impacts and risks imposed by the presence of these pests.
A novel approach to wing-flapping recording devices has been announced recently. The core idea behind these new sensors is to embed a photoreceptor in an insect trap to record the fluctuations of light as an insect flies through the laser beam and partially occludes light with its flapping. The sonification of the baseband signal produced by the light fluctuations represents normal sound that is subsequently recorded using audio recorders.
We put new work in context by providing algorithmic details associated with two different datasets that have been made publicly available by the University of California Riverside. The recorded insects are:
- AEDES AEGYPTI yellow fever mosquito
- ANOPHELES GAMBIAE mosquito
- APIS MELLIFERA western honey bee
- COTINIS MUTABILIS figeater beetle
- CULEX QUINQUEFASCIATUS southern house mosquito
- CULEX TARSALIS mosquito
- CULEX STIGMATOSOMA mosquito
- DROSOPHILA MELANOGASTER common fruit fly
- FUNGUS GNAT short-lived flies
- MUSCA DOMESTICA common housefly
- PSYCHODIDAE DIPTERAL moth fly
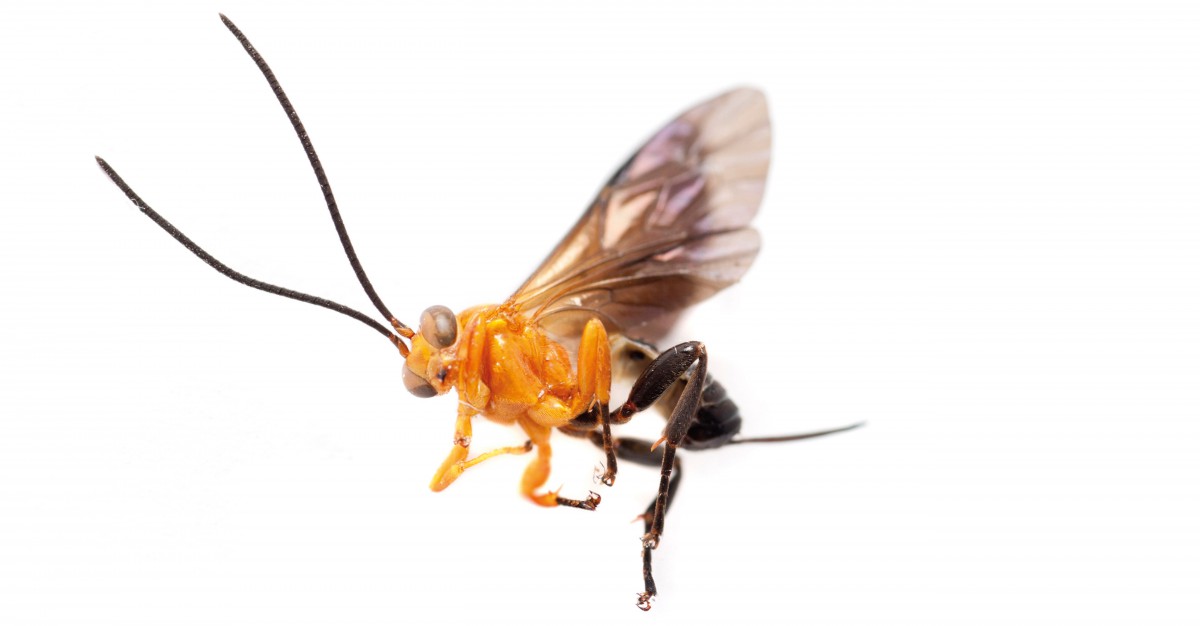
A photoreceptor records the fluctuations of light as an insect flies through a laser beam and partially occludes light with its flapping.
The main source of misclassifications results almost completely from species that are very similar in size and morphology, e.g. aedes aegypti male can be misclassified to culex tarsalis male but never as apis mellifera, which is a much largerinsect compared to mosquitoes. Note also that mosquitoes are dimorphic with females being larger than males. Therefore, acoustic discrimination of sex is not as difficult as it might seem on first impression. In our experiments the most accurate approaches never confuse a culex quinquefasciatus male with a culex quinquefasciatus female.
An audio file can be reinterpreted as a time series. This connects bio-acoustics to time series analysis by the transformation of the process of finding similar audio files to finding similar time series. We built feature vectors based on SFA. Our approach reduces random noise and accounts for differences in insect movement by the use of quantization on top of the Fourier spectrum. SFA proved to be one of the top scoring approaches applied in the evaluation.
