The goal of this project is to develop an analysis environment for high-resolution CT scans of porous materials. This environment will integrate methods to compute the topological structure of the pore space and use image processing algorithms as well as geometric algorithms to exactly assess geometrical properties. Furthermore, the characteristics of the extracted structures will be investigated and determined. The visualization software Amira provides the framework for the analysis tools.
Background
Particle Structure
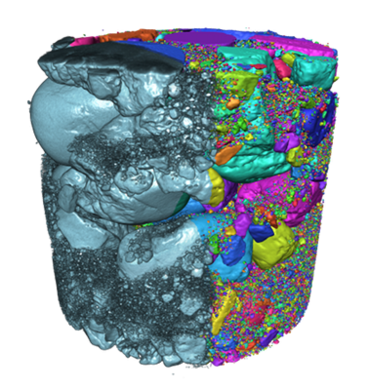
Fig. 1: Initial volume (grey) and extracted particles (colored) |
Pore Structure
The segmentation results also provide a basis for analyzing the pore space. Interesting elements of the pore space are pores, pore paths and pore constrictions. These elements can be described by the topology of the distance transform containing the distances to the boundaries of the segmented particles. The elements of the pore structure and other parameters e.g. radii can be extracted from CT data and used to construct a graph representing the pore space. Here, we apply a Voronoi-like approach to obtain these structures [Homberg et al. 2012]. The idea is a watershed propagation of the labeled particle regions based on the distance transform. The pore graph is constructed from all points of cell boundaries with at least three adjoining particle regions. This approach allows us to represent the topology of the pore space by a compact pore graph. To extract the pore bodies, again, we apply a watershed-based method marked by the extracted pore centers of the pore graph. These results, in turn, can be used to derive parameters (pore constriction distribution, connectedness quantities) for simulating suffosion processes.

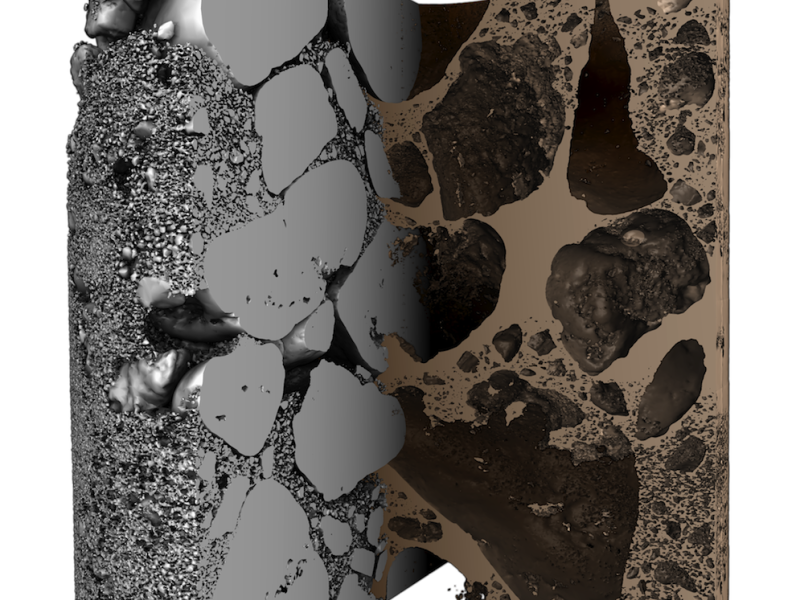
Fig. 2: Extracted elements of the pore space. (a) Detail of the distance map and constructed pore graph; (b) Two pore bodies and pore graph within particles; (c) Pore graph within the particle structure.
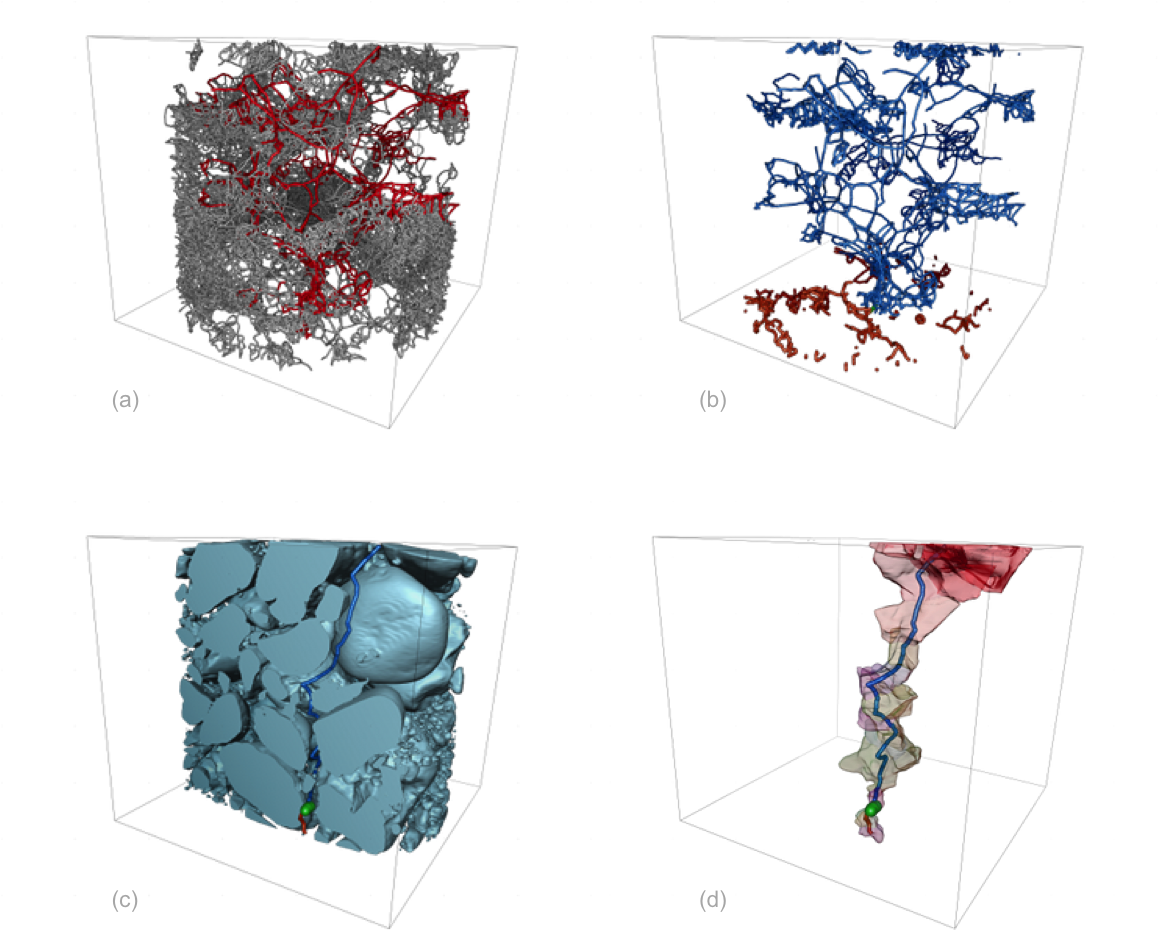
The constructed pore graph allows us to use this compact representation for an efficient analysis of transport possibilities. We apply a method that successively blocks the critical percolation edges in order to determine size-dependent transport possibilities. Here, an iterative min-cut adaption filters the maximal radius that holds the top-bottom connection and finds and cuts the edges of that radius which particles have to pass. The described process computes a decomposition of the pore graph into a top-subgraph and a bottom-subgraph connected by the critical edges in each iteration. These results can be used to estimate a size-dependent cumulative number of possibilities as well as an upper bound of the largest mobile particle.

Fig. 3: (a) Radius-filtered pore graph (red) within the initial pore graph (grey); (b) Top-bottom decomposition of the transport possibilities for a chosen particle size; (c) Possible transport path and its critical edge (green) through the particles; (d) Transport path and its channel of pores.

