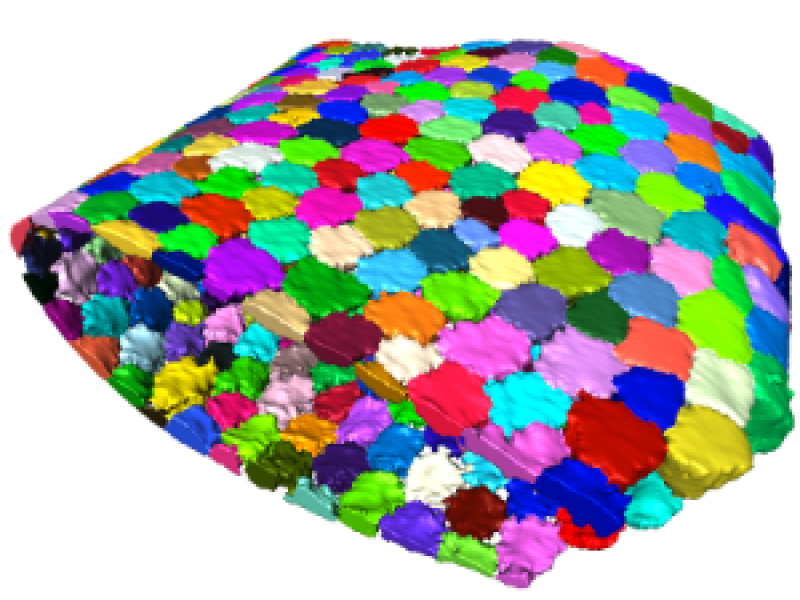
Unlike most other vertebrate animals, sharks and rays have skeletons made entirely of cartilage and not bone. In contrast to the cartilage in our knees, however, a shark’s skeleton is “tessellated”: skeletal elements made of uncalcified cartilage are wrapped in an outer layer of thousands of mineralized tiles called tesserae. Although this character has defined the shark and ray lineage for hundreds of millions of years, it is still unclear what role skeletal tiling plays in the mechanics and growth of this ancient, composite skeletal material. The HFSP-funded project aims to describe the tiling morphologies of shark and ray cartilaginous skeletons, to understand their importance to the mechanical behavior of the skeleton. Through several collaborations, we use an integrative and iterative approach of morphological analyses, materials and mechanical testing, and modeling (physical, digital and theoretical). The subproject at ZIB focuses on the analysis of µCT data of shark and ray skeletons. In particular, the aim is to develop tools for flexible segmentations of the tessellated network, allowing the first 3d quantifications and visualizations of these tiling patterns and allowing comparison among species and developmental stages, but also with idealized tiled surfaces.
Segmentation Workflow
We have developed a workflow for the segmentation of µCT data sets of ray tesserae. Since the scalar value distribution of the tesserae does not enable a separation of the individual tesserae, we are using the following multi-step approach:
- Pre-processing with anisotropic diffusion
- Binary segmentation of the tesseral layer using a local thresholding approach
- Computation of a 2D distance transform of the tesseral layer
- Segmentation of individual tesserae based on hierarchical watershed on the 2D distance map
- Computation of a graph representation for comfortable interactive correction of segmentation errors

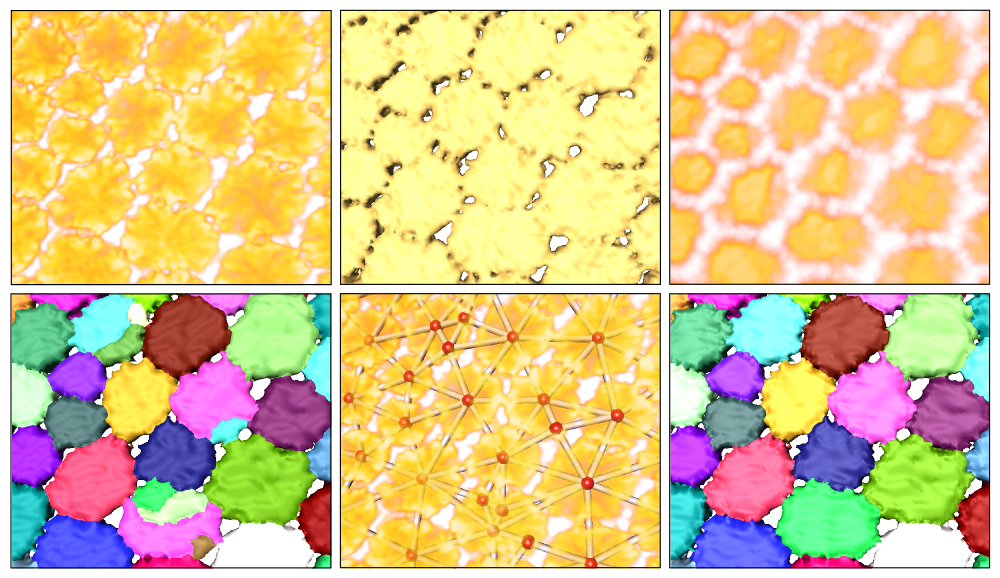
Segmentation workflow (from left to right and top to bottom): Volume rendering of original data; surface of binary segmentation; volume rendering of distance field; initial segmentation using distance field; graph representation; final segmentation.
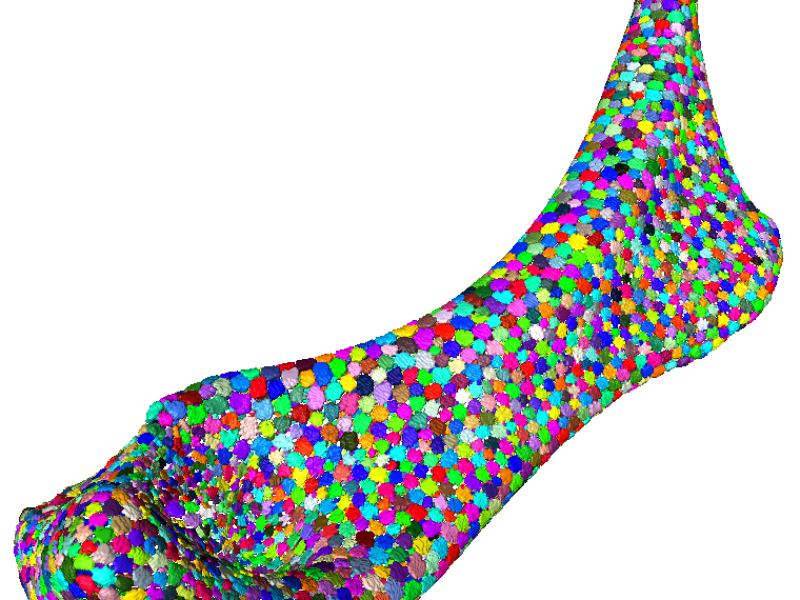
For evaluation, the segmentation pipeline was applied to the right hyomandibulae of three ages of stingray, each consisting of thousands of tesserae. Quantitative evaluation was done by comparing manually-placed landmarks with the segmented tesserae (via precision/recall values), and by computing RAND and VI values for manually-segmented areas created by four persons.
Results
The segmentation pipeline was applied successfully to the left and right hyomandibulae of six ages of stingray in approximately 5 hours of work per dataset (compared to days or weeks of work for a manual segmentation). This will allow the first quantifications ever done for this kind of biological, tesselated data.

