Introduction
The analysis and visualization of molecular structures is a large research area. In our project, we focus on methods based on the van-der-Waals spheres of the atoms. We developed fast computation and rendering methods for molecular surfaces. These surfaces are most often used to study molecular behaviour and interactions. They show regions accessible for other molecules like substrates. Furthermore, we work on the extraction of geometric molecular paths. We developed a fast approach to compute all of these paths inside a molecule. Our novel visualization techniques support the analysis and offer easy views into cavities and tunnels.
Surface Definitions
Two very important molecular surfaces are the solvent excluded surface (SES) and the molecular skin surface (MSS). Both surfaces are based on the van-der-Waals spheres of the atoms. The SES is defined as the surface enclosing all points, that are not accessible to a given probe sphere. This probe typically approximates solvents, most often water is used. The SES can be seen as the track of the probe which rolls over the atom spheres. In contrast, the MSS has no chemical background and is defined by a shrink factor which decomposes the surface into quadric patches. If the shrink factor is close to 0, the surface becomes nearly the convex hull of the atom spheres. For a shrink factor equal to 1, the surface is identical to the surface described by the atom spheres, called van-der-Waals surface. The MSS is complete tangent continuous for a shrink factor smaller than 1. In contrast, the SES can have singularities represented by sharp edges and consists of spherical patches as well as toroidal patches of degree four.

Comparison of SES (left) and MSS (right). The SES is defined by the probe sphere, which approximates a water molecule. For the MSS, we used a shrink factor of 0.3, which creates a topologically similar surface to the SES.
Surface Computation
The analytical description of the SES as well as the MSS can be computed very fast by weighted Voronoi diagrams given by the position of the atoms and their van-der-Waals radii. It is not necessary to compute the correct Voronoi diagram, but an approximation of the Voronoi cells is sufficient, where each cell depends only on the neighboring atoms. Varshney et al. (1994) presented a definition for the neighborhood of atoms for the SES and a fast parallel algorithm. We developed the neighborhood definition for the MSS to use the same concept.

Approximation of the Voronoi cells of the SES for the red and yellow atom (left). Neighbourhood definition for the MSS (right). The red atoms are neighbours, while the yellow atoms are not.
Surface Rendering
Most visualization tools triangulate the molecular surfaces. This takes several seconds for molecules with a few thousand atoms. For large molecules, the surfaces can consist of several million triangles, so it is not possible to visualize them interactively. We developed a GPU-based raycasting technique for both surfaces, similar to Chavent et al. (2009) and Krone et al (2010). This technique allows the user to visualize surfaces with about 100.000 atoms at interactive frame rates. Combined with our fast computation we are able to render dynamic surfaces for molecules with several thousand atoms. We implemented also classical visualization techniques like coloring, silhouettes, depth darkening and surface blending.

Visualization techniques for molecular surfaces. Depth darkening (left), coloring and silhouettes (middle) and surface blending (right).
Path Computation
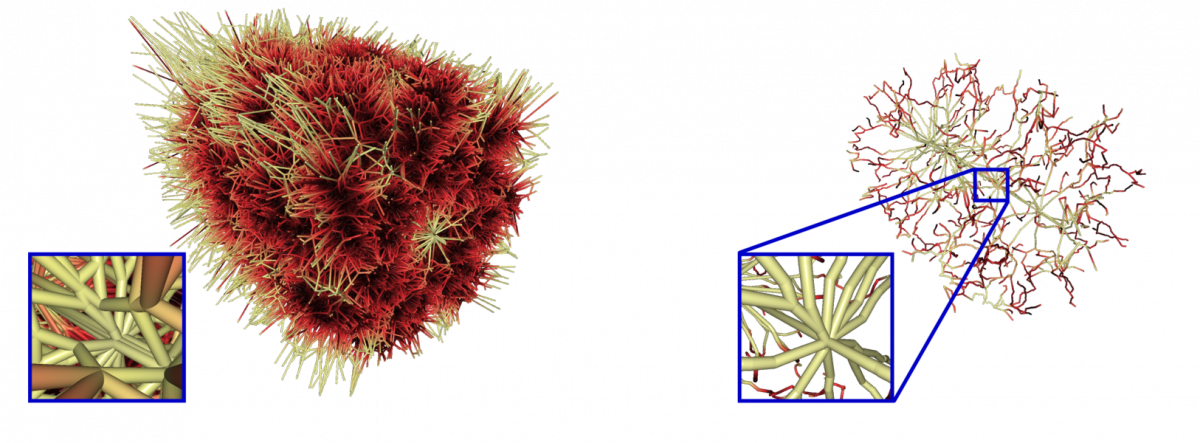
Currently, we compute molecular paths based on the geometry of the van-der-Waals spheres of the atoms. The edges of the Voronoi diagram of the atom spheres consists of all possible paths with maximal circular cross section. We developed data structures for a very fast computation of the Voronoi diagram of spheres with the edge tracing algorithm by Kim et al. (2005). A lot of paths of the Voronoi diagram are redundant, because there are more significant paths. Furthermore, there are many paths outside of the domain of the molecule and paths with too small or negative cross sections. We developed a novel filtering technique to keep only the most significant paths of the molecule. The overall computation takes less than one minute, even for molecules with approximately 100.000 atoms.

Voronoi diagram of the chaperonin protein 1AON clipped with the bounding box and after filtering.
Path Visualization
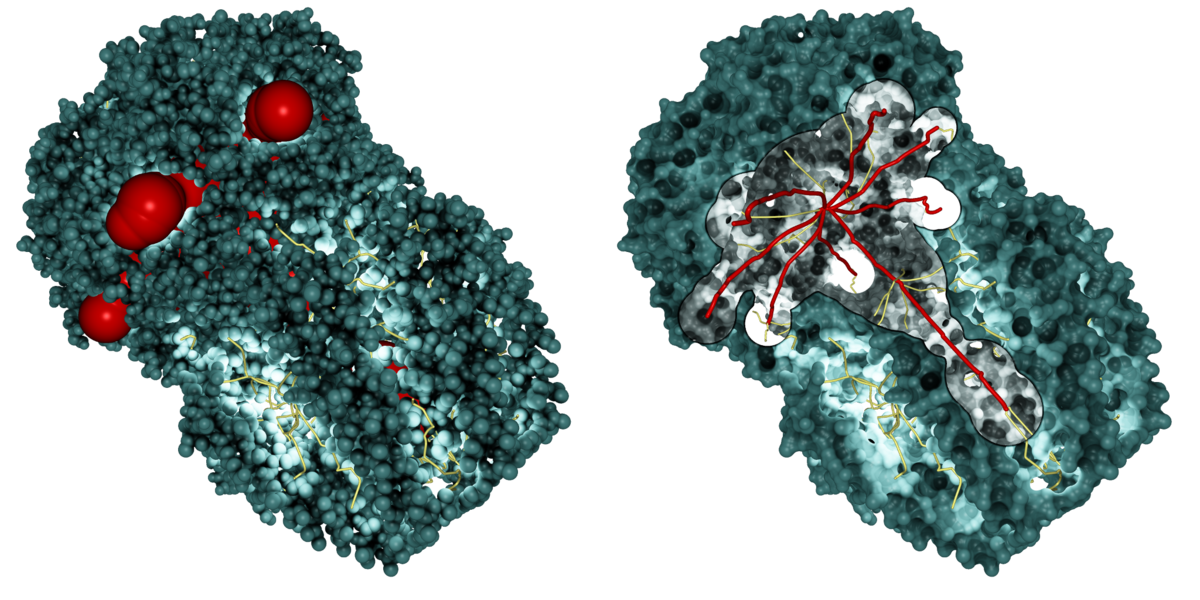
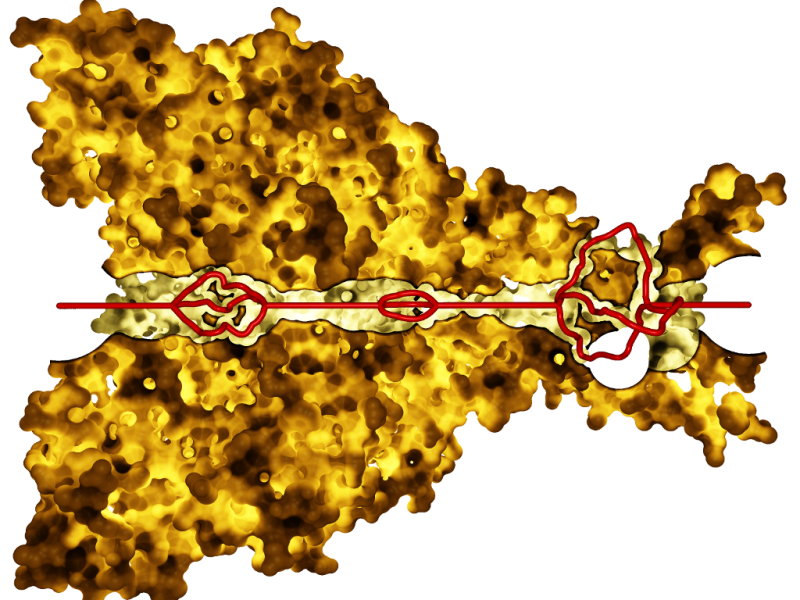
Path visualization in dense geometry is a challenging problem in computer graphics. We developed several techniques to enable a fast analysis of the molecular structure. In a first step, we place a lot of small point lights along the extracted paths, which highlight the molecular surface in cavities and tunnels. To keep interactive frame rates, we use deferred shading with high dynamic range rendering to avoid artifacts. We also implemented screen space ambient occlusion for a better depth impression. Furthermore, we provide surface clipping for selected paths, which allows one to analyze the dimension and the cavities of the selected paths.

Our path lighting with surface clipping for the selected paths (red)
Dynamic Paths
In order to analyze cavities and channels in dynamic molecular data from simulations, we compute all molecular paths for all time steps of the trajectory. The user is allowed to select one or more path components of the overall path graph for an arbitrary time step. Note that each path component corresponds to exactly one cavity or channel. The selected path components will be traced over time by analyzing the intersections of the corresponding cavities with all cavities in the consecutive time step. A valid tracing is found if an intersection is large enough so that a given probe sphere is able to move from one cavity into a cavity of the consecutive time step. During this analysis, cavity splits and merges are detected and visualized in a 2-dimensional graph. Each path in this graph describes a possible geometrical dynamic behavior of the cavity. Thus, dynamic molecular channels can be detected. The dynamic cavities and channels can be visualized either by the skin surface or volume rendering. We tested our tool for the membrane protein bacteriorhodopsin, which works as a light driven proton pump.

(1) A bacteriorhodopsin monomer displayed as surface and cartoons, with the retinal, shown as bonds, covalently bound to Lys216. (2) All cavities of the monomer as found at time step 651; the cavity shown in red is traced over time. (3) Split and merge graph of path tracing. (4) A dynamic molecular path, connecting the cytoplasmic (top) and the extracellular side (bottom), based on the selection in the split and merge graph.
