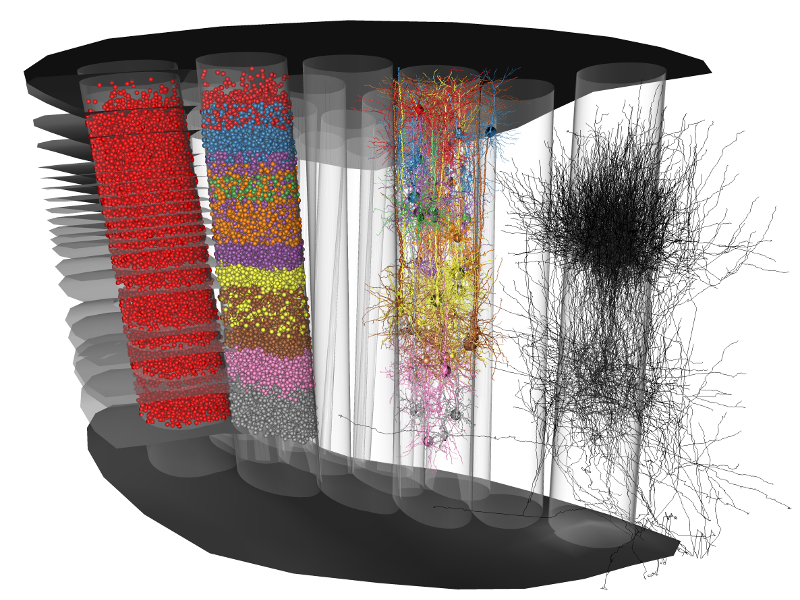
The goal of this project is to develop tools to model and analyze 3D neural networks of the rat primary somatosensory cortex, also called 'barrel cortex'. This will help neuroscientists to better understand structure-function relationships of sensory cortices at cellular level. Cortices are organized into multiple cortical columns – the smallest anatomical and functional unit of the mammalian cortex. Although single cell reconstructions of functionally characterized neurons are available, so far it has not been possible to reconstruct an average cortical column. This requires consideration of neuron reconstructions and landmark information from many individual brains.
Therefore, a software environment based on interactive and automatic techniques will be implemented which enables researchers to efficiently reconstruct individual neurons and anatomical structures from histological sections. Furthermore, tools will be developed to create anatomically realistic networks of neurons and their synaptic connections representing, e.g., a cortical column or the barrel cortex. Finally, new effective tools will be created for the visual analysis of such models, allowing neuroscientists to better understand cortical anatomy and function.
Working steps
Project goal is to create an anatomically realistic 3D model of the rat primary somatosensory cortex at the level of individual neurons and their synaptic connections. Such a model aids neuroscientists in understanding the relation between structure and function of the modeled brain region of interest. To achieve this, the following steps have to be taken:
- Reconstruction of a large number of individual neurons (axons and dendrites) and surrounding reference structures.
Problems: segmentation / tracing, alignment of histological sections, splicing (connecting) neuron endings across sections. - Computation of number and position of neurons in the brain region of interest.
Problems: segmentation of densely packed blobby objects in 3D microscopic images. - Assembly of a network of neurons, e.g. a cortical column or the entire barrel cortex, and estimation of synaptic connectivity between (groups of) neurons.
Problems: alignment of cells within column, determine connectivity, handling of very large numbers of cell morphologies. - Visualization and analysis of synaptic connectivity in the model.
Problems: very large number of neurons and neuron groups, complex connection patterns. - Simulation of intra- and intercellular electrochemical processes of neurons in the network.
Problems: large networks, many time-steps, multiple quantities (these problems are worked on by the Universität Stuttgart).
Reconstruction of individual neurons
In this project, a processing pipeline was established for the 3D reconstruction of complex neuronal branching patterns (both axonal and dendritical) from brightfield image data. Neurons are reconstructed using the following procedure:
- Staining of neurons and reference structures (landmarks)
- Cutting of brain tissue into tangential sections (approx. 20 slices of 50-100 micrometer thickness).
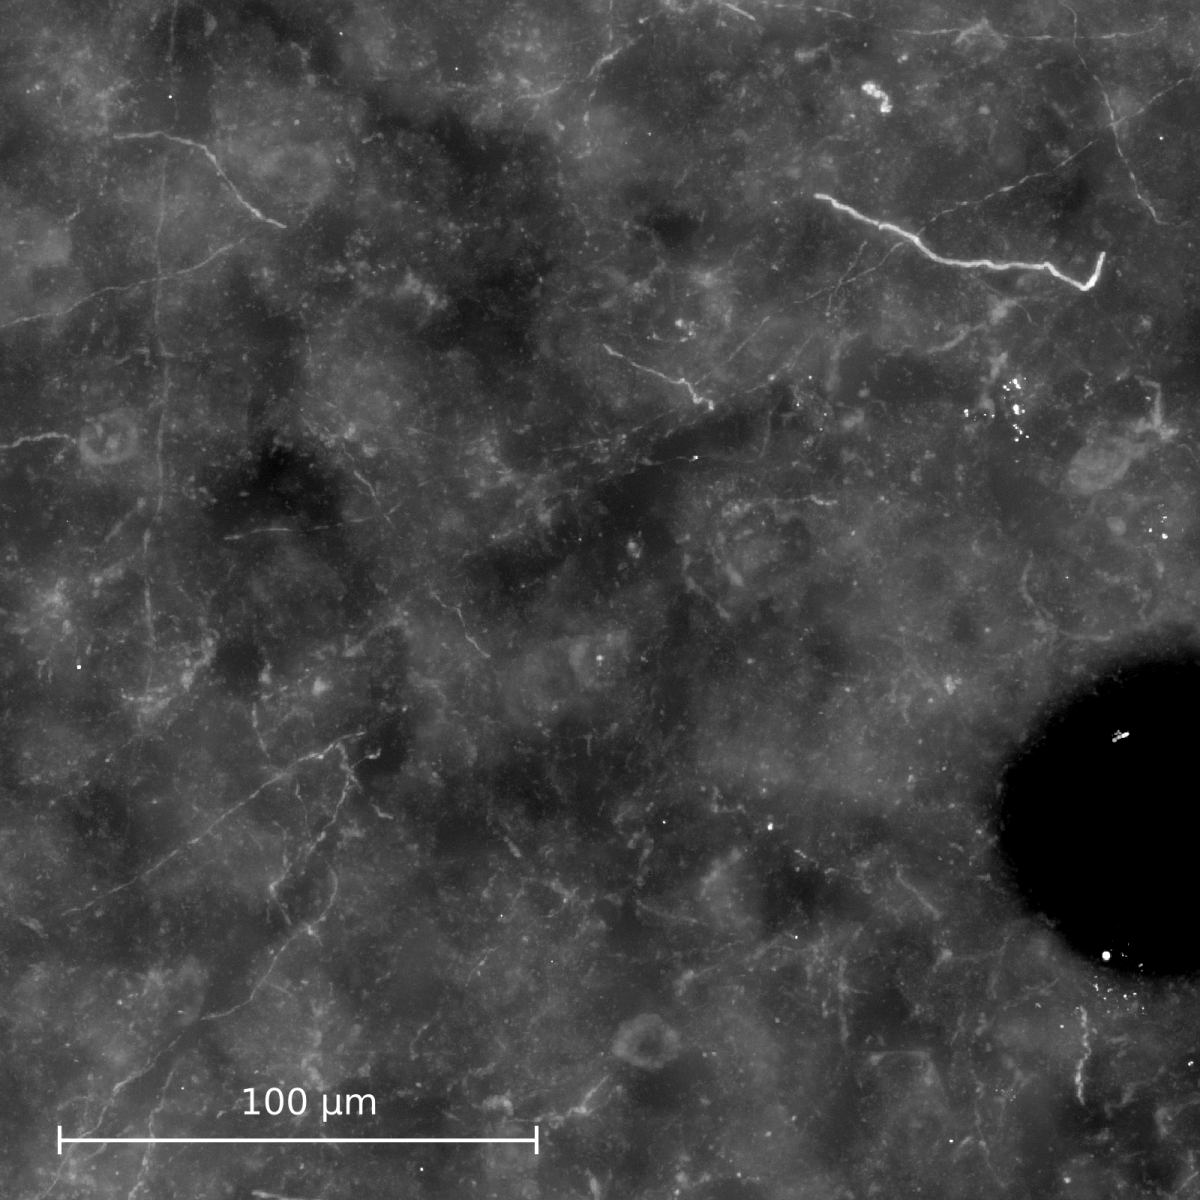
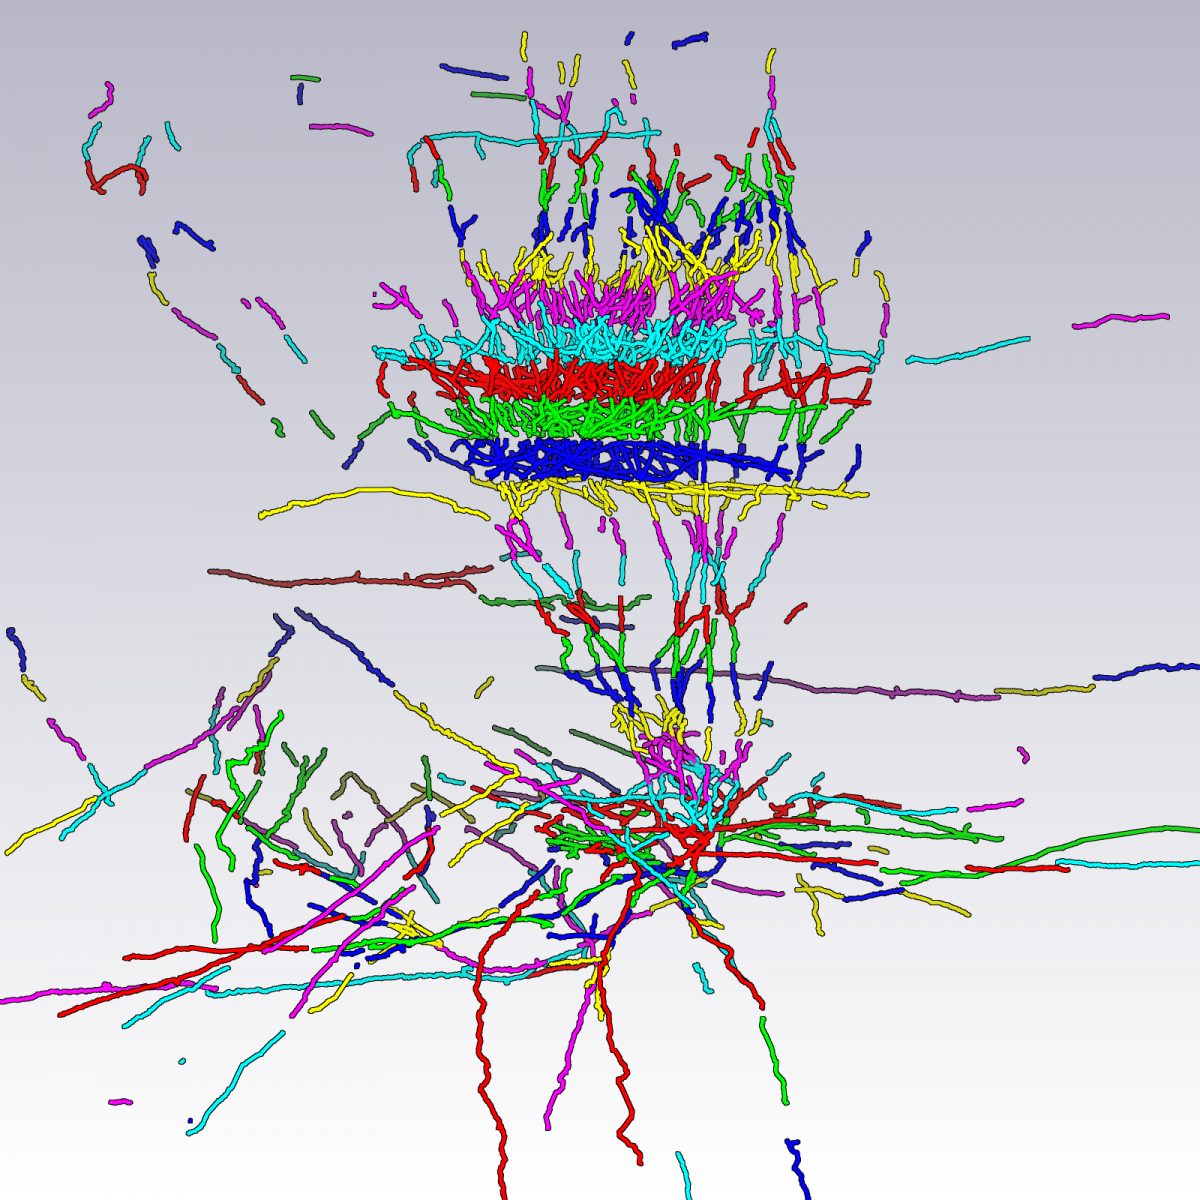
- High-resolution microscopic imaging. Multiple images per section are created by varying the focus (Fig. (a)).
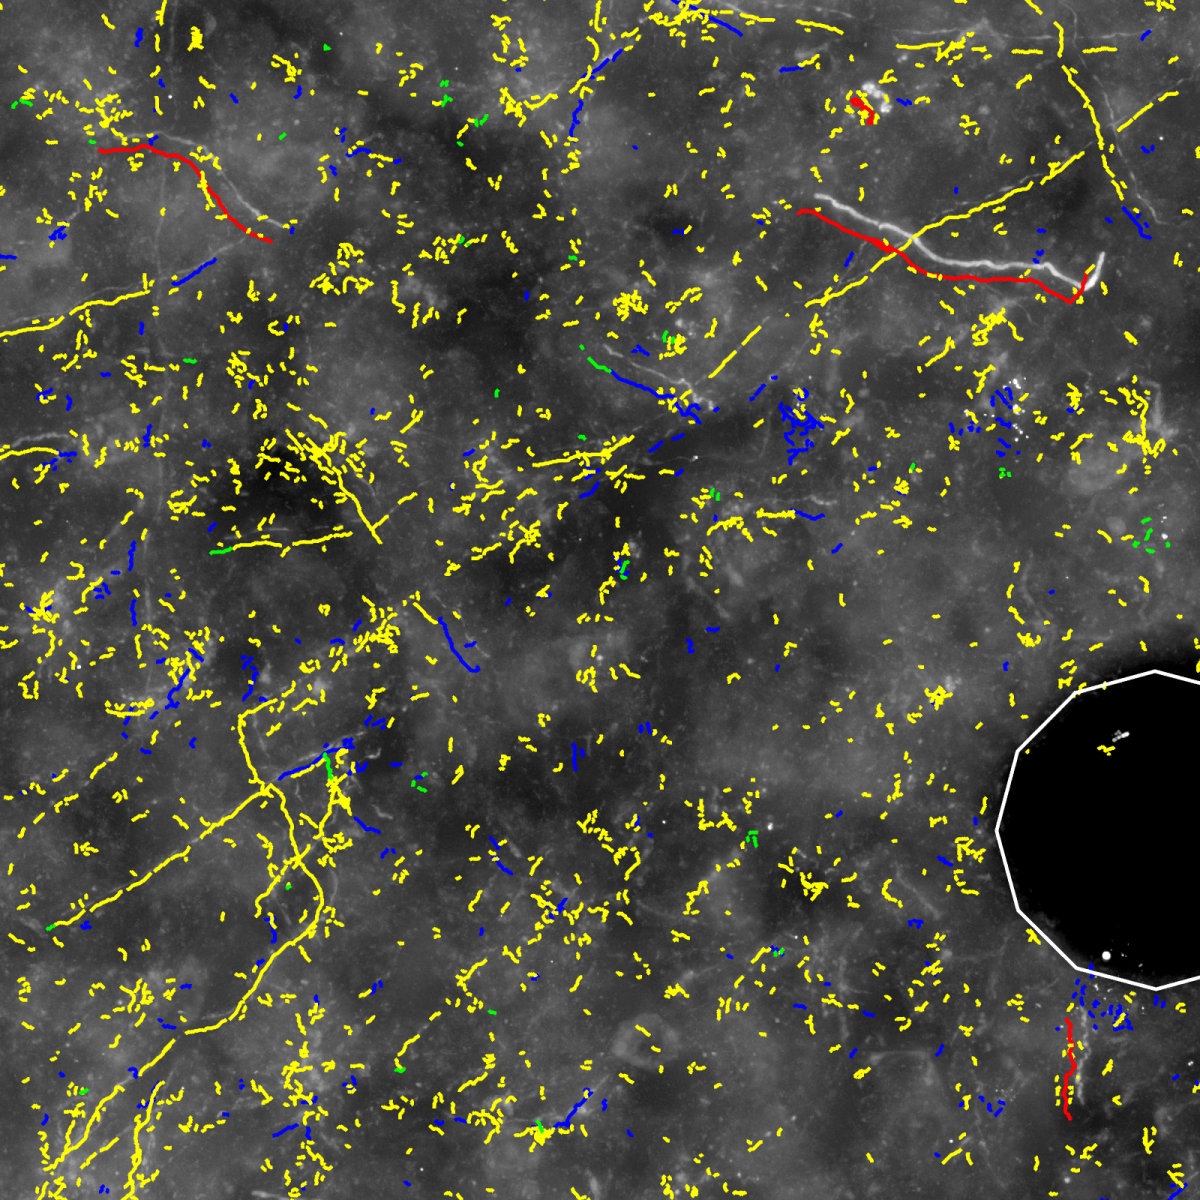
- Automatic segmentation of neuronal structures in each stack using NeuroMorph software, developed at the MPI of Medical Research/Neurobiology (Fig. (b)) (Oberlaender et al. 2007).
- Intra-section splicing (connecting fragment endings) and removal of misclassifications (dirt).
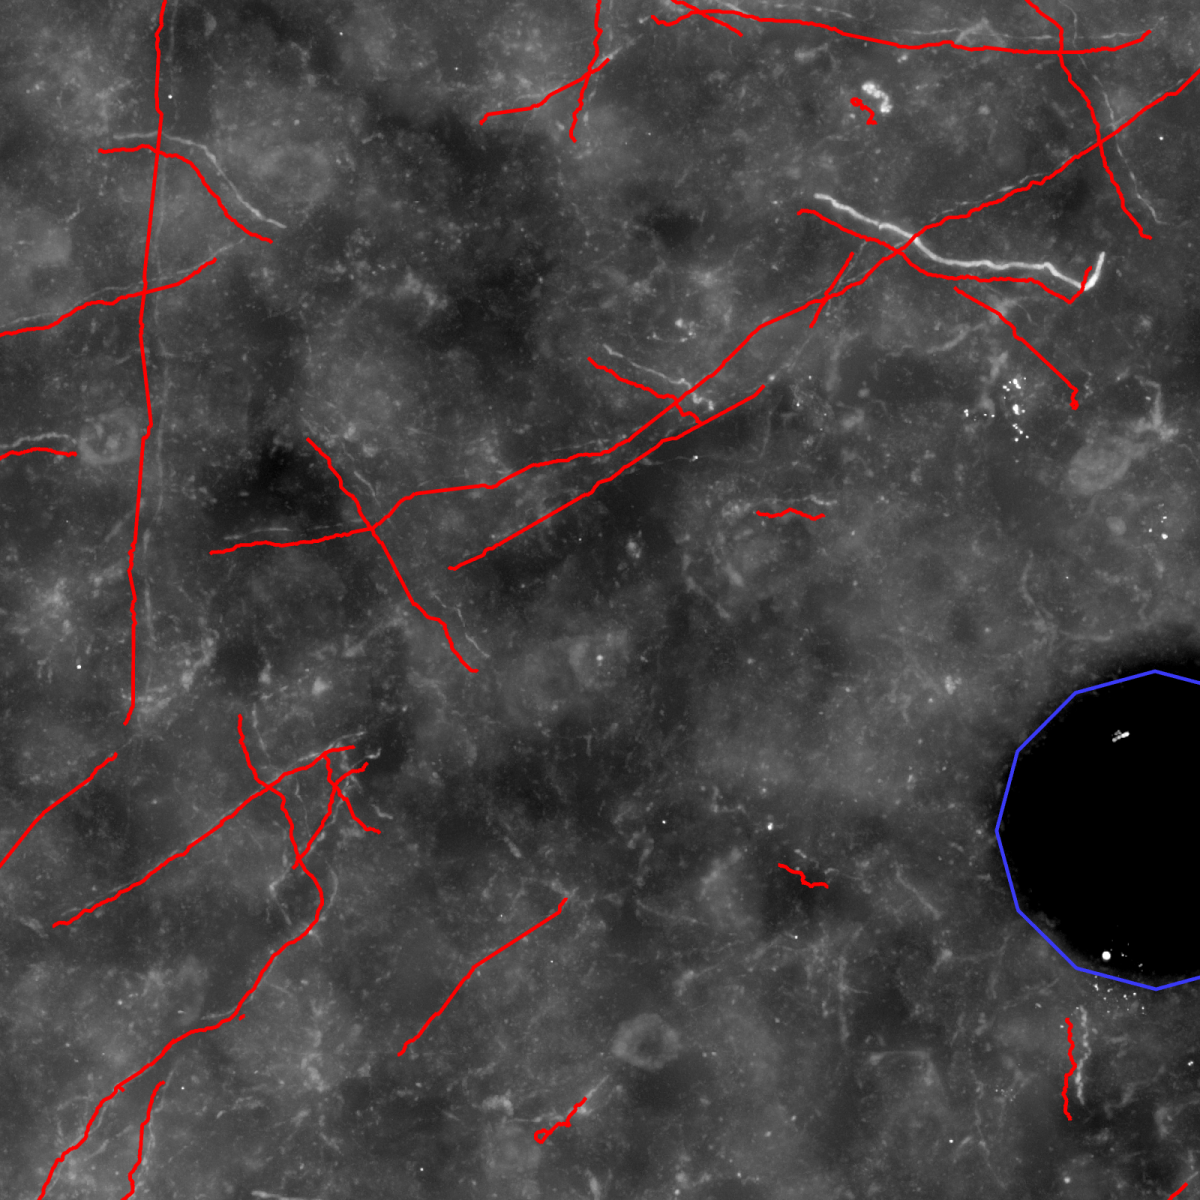
- Alignment of the stacks (Fig. (c), (d) and (e)).
- Inter-section splicing of neuron fragments.
- Segmentation of surrounding reference structures.
- Assignment of semantic labels to all structures and sub-structures in the data set.
 |  |
 |  |
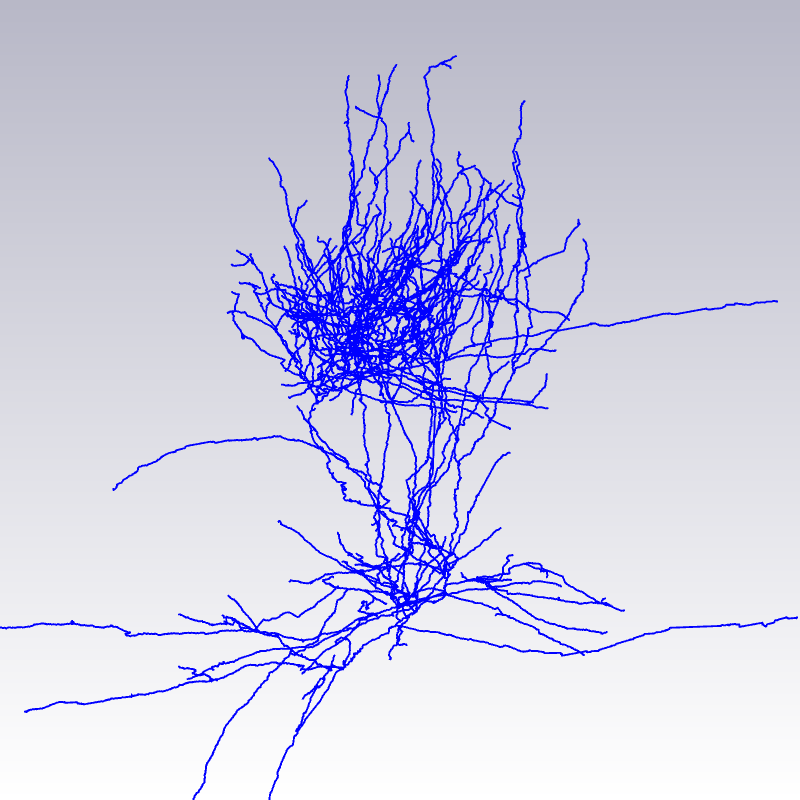 |
(a) Maximum intensity projection image of a cut-out of single image stack. (b) Automatically computed segmentation. (c) Section after manual pre-processing. (d) After section alignment. (e) Completely reconstructed axon. Data used for creating images are provided by Marcel Oberlaender, Department of Digital Neuroanatomy, Max Planck Florida Institute, USA. |
In order to efficiently reconstruct individual neurons, the following tools and methods have been developed within the scope of this project:
- Data structure for representing graphs embedded in 3D space, including attributes.
- Editor for fast and convenient interactive manipulation of graph data structure in 3D, including dirt removal and splicing (step 5, 7).
- Automatic alignment of reconstructed slices using a point matching approach based on clique detection (Dercksen 2009) (step 6).
The main advantages of our approach are:
- Allows tracing of thin, complex and long-ranging axons, that may suffer from limited dye penetration, resulting in poor contrast.
- The "removal of false positive" strategy makes missing branches less likely, compared to a search for new branches and adding them to existing ones.
- No expert tracer required (as with conventional interactive tracing, using e.g. Neurolucida). Novices can do the section post-processing, alignment and splicing after a few hours of training.
- Higher throughput than with conventional tracing, due to less manual labor and highly parallellizable tasks.
- Semantic labeling allows for effective visual and quantitative analysis.
Automated three-dimensional detection and counting of neuron somata
Goal: Determine the number and position of neuron cell bodies (somata) in a 3D data set. As the cell bodies can be densely packed, they may appear connected. The somata need to be divided into the correct number.
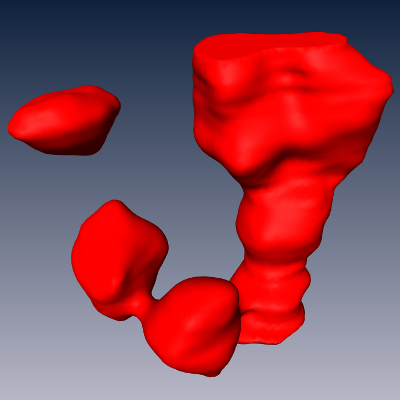
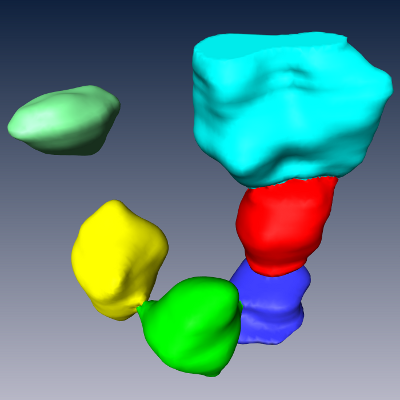
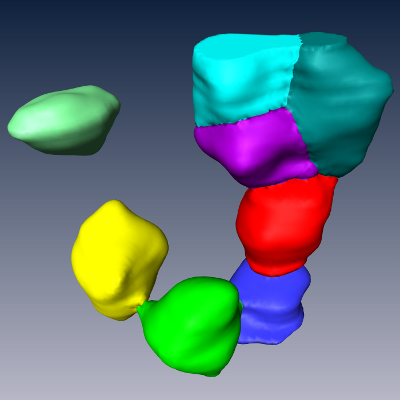
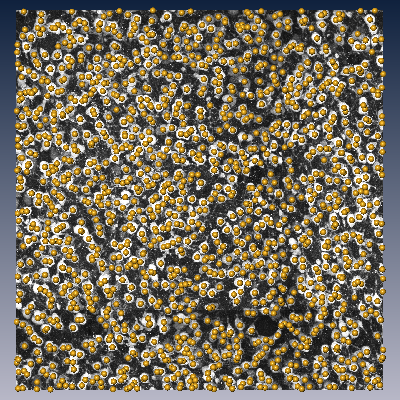
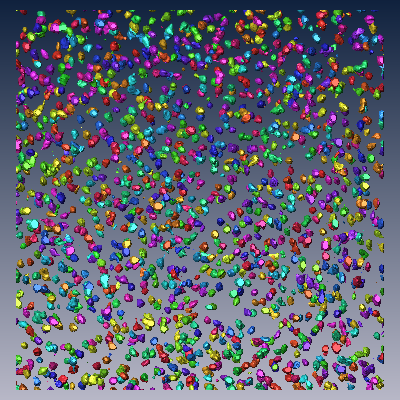
An automatic segmentation and counting method has been developed, consisting of three steps (Oberlaender 2009): (1) binary segmentation (Fig. (b)), (2) watershed-based splitting of connected somata (c) and (3) model-based splitting of remaining connected somata (d).
The method works for various stain-microscope combinations, particularly NeuN/confocal (see Fig. (a)), NeuN/brightfield and Calcium/2-photon images.
Automation of soma position determination allows for the exhaustive counting of cell bodies in large brain tissue volumes, such as a cortical column (Fig. (g)). Errors due to conventional sparse sampling methods (such stereology) can thus be avoided.
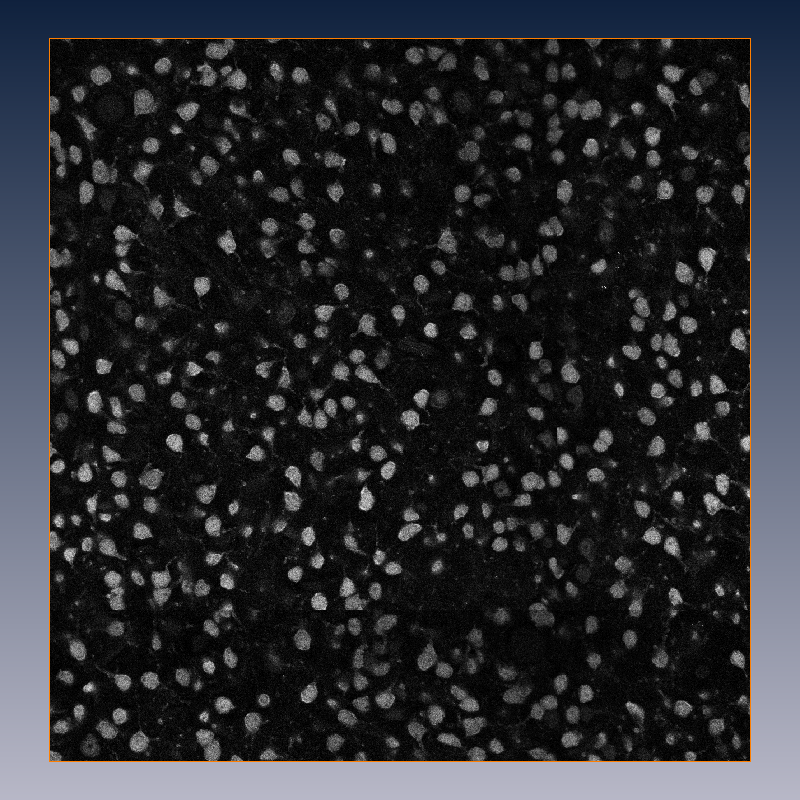 |
(a) Single section of a 3D confocal data set with NeuN-stained somata.
|
| (b) The first step produces a binary segmentation using a sequence of image filters. Shown is a surface resulting from triangulation of the binary image. (c) The second step splits clusters of connected somata at their thin necks using marker-based watershed segmentation. (d) In the third, final step any remaining touching objects are split based on a statistical approach that uses the volume distribution of all cell bodies found thus far to determine the most likely number of constituting cell bodies for each cluster. |
|
 |  |  |
 |  |
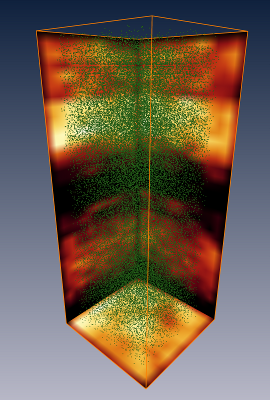 |
(e) Maximum intensity projection of 3D image containing stained somata and the centroids of the automatically detected somata. (f) Automatically detected somata. (g) Automatically detected somata in volume containing a single cortical column. The result has been assembled from the results of 2x2x40 individually processed 3D images of physical sections. |
Assembly of a neural network representing the barrel cortex
Goal: tool to generate a neuron population representing the barrel cortex and its synaptic connections.
The NeuroNet tool, developed within this project, creates such neural networks by generating populations consisting of reconstructed morphologies, positioned such that satisfy the 3D soma density (Fig. a-e, below).
Synaptic connectivity between neurons is estimated based on structural overlap of axons and dendrites (Peters' rule, Fig. f-i).
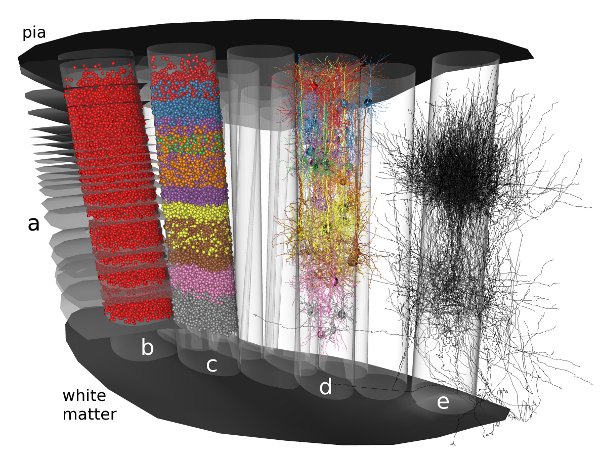
Modeling steps: 1) Cell body distribution (b). 2) Cell type assignment according to region-specific cell type mixtures (a, c). 3) Dendrite placement (d). 4) Axon placement (e).
The NeuroNet tool has been applied to generate the following anatomical neural network models:
- a two-celltype model, consisting of thalamic VPM and cortical L4 Spiny stellate neurons (~3000). This model was used for numerical simulations (Lang 2011),
- a cortical column model, consisting of 10 cell types (~20.000 neurons) (Oberlaender 2012),
- entire barrel cortex, consisting of 10 cell types and 24 cortical columns (~0.5 Million neurons) (Dercksen 2012).
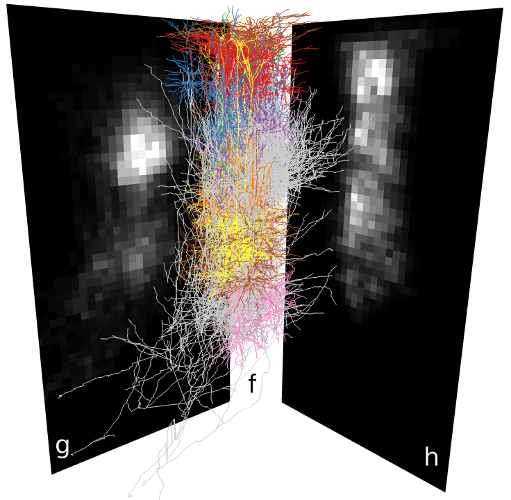 | 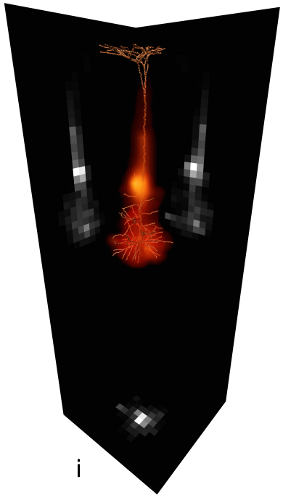 |
| Synaptic connectivity in a neuron population (f) is estimated by dividing the local number of boutons (g) among local spines (h). Synapse density on the dendrites of a single neuron (i). | |
Framework for Visual Analysis of Synaptic Connectivity
Goal: tool for visual analysis of synaptic connectivity.
The anatomically realistic neural network models consist of (i) a geometrical description of all neurons, and (ii) metadata concerning cell types, columns and subcellular structures. This allows to compute synaptic connectivity information at the multiple scales, i.e. at the subcellular, cellular and population level.
In order to make this connectivity information accessible for visual and quantitative analysis, we developed an interactive visualization framework (Dercksen 2012). It comprises 3 coordinated views (see figures below):
- connectivity matrix view,
- Cortical Column Connectivity Viewer (CCCV),
- 3D synapse location view
This tool was applied to the 3D barrel cortex model, containing approximately 0.5 million neurons of 10 different cell types in 24 cortical columns to show its effectiveness in answering neuroscientific questions, for example:
- Where does a neuron or group of neurons obtain input from, i.e. to which presynaptic cells is it connected? Or, conversely, where does a presynaptic group project to?
- How are synapses distributed on the postsynaptic cell? Can cell type-specific clustering of synapses at particular locations be identified?

(1) The connectivity matrix visualization using a heatmap shows synaptic strength between each pre- and postsynaptic group (column-cell type combination). It is the standard visualization, but provides no spatial context.
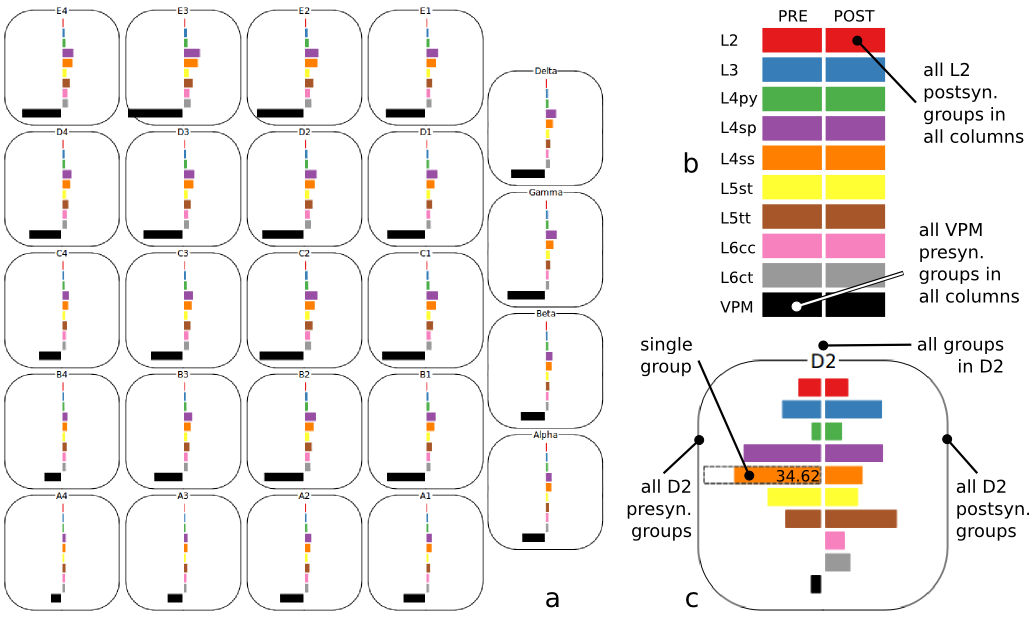
(2) The Cortical Column Connectivity Viewer (CCCV, a) is an interactive tool to explore synaptic connectivity within and between cortical columns. The layout of columns mimics the anatomical barrel field, providing spatial context. The colored bars show the number of synapses each selected presynaptic group (left side) shares with selected postsynaptic groups (right). Various selection options (b, c) allow efficient exploration.
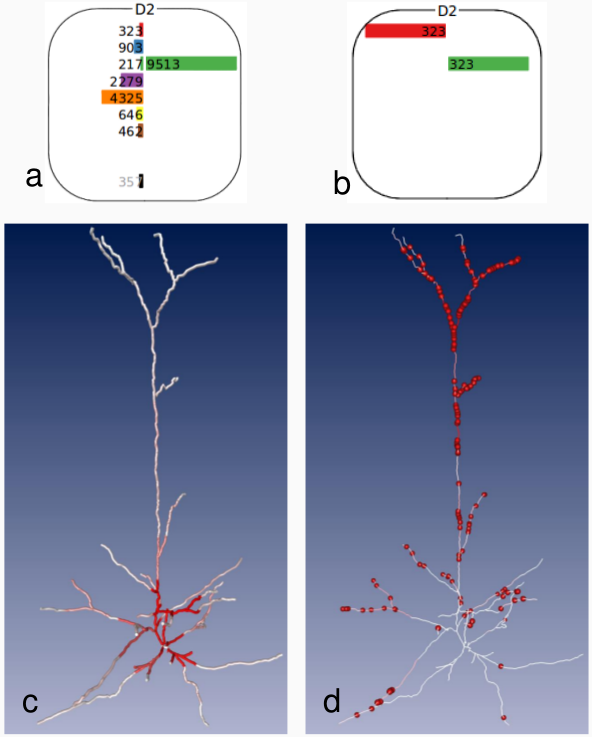
(3) 3D viewer showing synapse density (c) and positions (d) on dendrites of a selected L4 pyramidal neuron. The coupling with the CCCV allows for specific queries, e.g. synapses between all D2 cell types and L4py (a) or between L2 and L4py (b).
