How cells organize patterns in space and time
Researchers at ZIB develop data analysis and mathematical modeling techniques and apply them in cooperation with biologists in order to gain insight into fundamental principles of biological processes, such as cell division, protein regulation, and brain formation and activity.

Understanding Microtubule Organization during Cell Division
Microtubules are tube-like polymers that play an important role in cell division. They form the spindle, which is a microtubule assembly that segregates the chromosomes, see figure 1 (a,b). Electron tomography is the preferred technique to acquire most detailed spatial information about microtubules. The cells are prepared for electron microscopy as 300 nm thick serial sections (slices). With the application of image-processing techniques, we are able to automatically extract the microtubules within a section (FN:B. Weber, M. Möller, J.-M. Verbavatz, D. Baum, H.-C. Hege, S. Prohaska: Fast Tracing of Microtubule Centerlines in Electron Tomograms. BioVis 2011 Abstracts, 1st IEEE Symposium on Biological Data Visualization, 2011.), (FN:B. Weber, G. Greenan, S. Prohaska, D. Baum, H.-C. Hege, T. Müller-Reichert, A. Hyman, J.-M. Verbavatz: Automated Tracing of Microtubules in Electron Tomograms of Plastic Embedded samples of Caerhabditis Elegans Embryos. Journal of Structural Biology, 178[2], pp.129–138, 2012. DOI: 10.1016/j.jsb.2011.12.004), (FN:S. Redemann, B. Weber, M. Möller, J.-M. Verbavatz, A. A. Hyman, D. Baum, S. Prohaska, T. Müller-Reichert: The Segmentation of Microtubules in Electron Tomograms Using Amira. Mitosis, Springer, 2014. DOI: 10.1007/978-1-4939-0329-0_12) (see figure 1). Furthermore, we have been developing reconstruction methods for joining multiple sections to create a geometric model of the entire spindle (FN:B. Weber, E.M. Tranfield, J.L. Höög, D. Baum, C. Antony, T. Hyman, J.-M. Verbavatz, S. Prohaska: Automated Stitching of Microtubule Centerlines across Serial Section Tomograms. PLoS ONE, p. e113222, 2014. DOI: 10.1371/journal.pone.0113222), see figure 1 (c,d). Our integration of automated techniques with real-time user interactions allows handling of practical challenges during day-to-day research, such as varying tomogram quality. In cooperation with TU Dresden, we visually and quantitatively analyzed entire microtubule spindles of C. elegans for the first time (FN:S. Redemann, J. Baumgart, N. Lindow, M. Shelley, E. Nazockdast, A. Kratz, S. Prohaska, J. Brugués, S. Fürthauer, T. Müller-Reichert: C. Elegans Chromosomes Connect to Centrosomes by Anchoring into the Spindle Network. Nature Communications, 8, 2017. DOI: 10.1038/ncomms15288). We identified different classes of microtubules and analyzed geometrical properties, such as length and density distributions. In particular, we investigated potential microtubule interactions based on their spatial arrangement. One major finding is that microtubules do not directly connect chromosomes and centrosomes, but form an interactive dynamic network. Currently, the full reconstruction and analysis pipeline is adapted for upcoming experiments that will study spindles in different phases of cell division, spindles in mutant organisms, meiotic spindles, and spindles of different species.
 The mitotic spindle during the metaphase of cell division in C.elegans: a Schematic of the microtubule spindle (green) and the chromosomes (blue). b Electron-microscopy image of the full cell. c Complete stitched electron-tomography serial-section stack (120 GB). d Segmented microtubules (green, red) and chromosomes (blue).
Cellular Reaction Kinetics
 for well-mixed stochastic reaction kinetics.") Chemical master equation (CME) for well-mixed stochastic reaction kinetics. It defines the temporal evolution of the probability P(x,t) to find the system at time t in a certain state x, given the reaction propensities
Chemical master equation (CME) for well-mixed stochastic reaction kinetics. It defines the temporal evolution of the probability P(x,t) to find the system at time t in a certain state x, given the reaction propensities ![]() .
.
Accurate modeling of reaction kinetics is important to understand how biological cells work. Spatially well-mixed reaction dynamics can be modeled by the chemical master equation (CME, see formula 2), an infinite set of ordinary differential equations, which is, in general, too complex to be solved analytically. There are accurate numerical simulation schemes for solving the CME indirectly, like Gillespie’s stochastic simulation algorithm (FN:D. T. Gillespie. Exact Stochastic Simulation of Coupled Chemical Reactions. Journal of Physical Chemistry, 81[25]:2340–2361, 1977.). For many relevant realistic settings, however, even our high-performance computers fail to create reliable statistics within an acceptable amount of time. This is the motivation to reduce the model complexity by considering approximative mathematical formulations of the cellular dynamics. Especially multiscale reaction systems, which often appear in real-world applications, are in the focus of our investigations because they require new combinations of existing approximation methods.
An example for a cellular reaction process that involves cascades of particle numbers is the process of gene expression, which is relevant for all known life. See figure 2 for an illustration. The information encoded in a gene is used for the synthesis of functional gene products, the proteins, which typically arise in bursts with much higher abundance than all other involved reactive species. In collaboration with the DFG research center CRC 1114 “Scaling cascades in complex systems,” we applied new hybrid methods to efficiently simulate the gene expression process and showed that, in contrast to classical uniform approximation methods, advanced hybrid schemes are able to reproduce the characteristic patterns of the cellular dynamics (FN:S. Winkelmann and C. Schütte. Hybrid Models for Chemical Reaction Networks: Multiscale Theory and Application to Gene Regulatory Systems. The Journal of Chemical Physics, 147[11]:114115, 2017.).
But what can we do if the central well-mixed assumption underlying the CME is broken and some spatial resolution is needed to capture the dynamics? Based on mathematical theory, we have been developing suitable extended models, like the spatiotemporal CME [8], to include the necessary spatial information, with the level of detail adapted to the reactive system under consideration. A eukaryotic cell, for example, naturally decomposes into several compartments (e.g. the nucleus and parts of the cytoplasm (see figure 3), which both have a central meaning for the process of gene expression. By making use of this natural cellular structure, we obtain models that are computationally practical and at the same time close to the reality of a biological cell. Spatiotemporal hybrid models form the basis for the simulation of cellular reaction kinetics in all relevant details; their use in massive simulation environments, however, still poses significant challenges that will be the motivation for further research in this direction at ZIB.
 Gene expression in a eukaryotic cell. In the nucleus, the DNA is transcribed into messenger RNA (mRNA), which is then exported to the cytoplasm and translated into proteins. Such cellular reaction kinetics can appropriately be characterized by the spatiotemporal chemical master equation (FN:S. Winkelmann and C. Schütte. The Spatiotemporal Master Equation: Approximation of Reaction-Diffusion Dynamics via Markov State Modeling. The Journal of Chemical Physics, 145[21]:214107, 2016.).
3-D Brain modeling to understand sensory information processing
How does the brain process information from our senses, and how does this ultimately lead to specific behavior? To investigate this question, we, together with our collaborators at CAESAR Bonn, created an anatomically realistic model of the part of the rat brain that processes information from the whisker hairs on the animal’s snout. The model consists of a large network of interconnected neurons.
 Single “spiny pyramid” neuron in a cortical column (transparent cylinder) in the rat brain, with its dendrites (red) and axons (gray). Synapse density (yellow) indicates where neurons of this type receive information through synaptic contacts. Data: M. Oberlaender (CAESAR Bonn).
In the recent past, we developed methods to count the number of neurons in the network from 3-D microscope images (FN:M. Oberlaender, V.J. Dercksen, R. Egger, M. Gensel, B. Sakmann, H.-C. Hege: Automated Three-Dimensional Detection and Counting of Neuron Somata. Journal of Neuroscience Methods, 180[1], pp. 147–160, 2009.). The synaptic connectivity between them, called the “connectome,” cannot, however, be directly recovered from image data at this scale. Therefore, we estimate the number of synapses and their location on the individual neurons based on morphological features, in particular spatial overlap between signal-sending axons and signal-receiving dendrites (figure 5) (FN:R. Egger, V.J. Dercksen, D. Udvary, H.-C. Hege, M. Oberlaender: Generation of Dense Statistical Connectomes from Sparse Morphological Data. Frontiers in Neuroanatomy, 8(129), 2014. DOI: 10.3389/fnana.2014.00129). This predicted connectivity turned out to match available measurements well.
 Modeling and analysis pipeline, consisting of an offline and an online part. The 3-D neural-network model is created using the Amira visualization software. The large connectome dataset is precomputed on a batch cluster. A Web application, intended for the research community and implemented using state-of-the-art Web frameworks and cloud technologies, provides a query interface to extract and analyze on the fly specific subsets of the large dataset.
Based on this realistic model, neuron simulations can be performed, which may provide insight into the function of each neuron type in the network (FN:R. Egger, V.J. Dercksen, C.P.J. Kock, M. Oberlaender: Reverse Engineering the 3-D Structure and Sensory-Evoked Signal Flow of Rat Vibrissal Cortex. The Computing Dendrite, Vol.11, pp. 127–145, Hermann Cuntz, Michiel W.H. Remme, Benjamin Torben-Nielsen [Eds.], Springer: New York, 2014.). Also, mathematical models, for example, describing population dynamics (FN:I.D. Landau, R. Egger, V.J. Dercksen, M. Oberlaender, H. Sompolinsky: The Impact of Structural Heterogeneity on Excitation-Inhibition Balance in Cortical Networks. Neuron, 92[5], pp. 1106–1121, 2016.), can be tested using this model, and may lead to a better understanding of biological mechanisms involved.
Currently, we are developing a Web application to make this model publicly available to the research community. Neuroscientists can perform in-silico experiments by interactively defining queries that extract specific information from this large dataset on the fly (figure 5).
Within the Priority Programme “Computational Connectomics” of the DFG (German Research Foundation) starting 2018, we aim to use a data-driven Bayesian approach to investigate more in depth what anatomical properties underlie synapse formation in order to make even more accurate predictions of network connectivity.
Stochasticity Driving Pattern Formation in Brain Wiring
Neurons form specific patterns in a very robust and reliable way during brain development. How axons and dendrites find the appropriate synaptic partners has been studied for decades. But the question is posed today with a new twist.
Axon Guidance Revisited
For the last 70 years, the dominant model of axon guidance has been based on global concentration gradients of guidance molecules. During axon growth, filopodia, small extrusions of the growth cone, sprout in different directions, as is visible in microscopy images. The general assumption has been that the filopodia sample the surroundings for chemical gradients of guidance molecules, allowing them to find the right direction despite the stochasticity of molecule sensing.
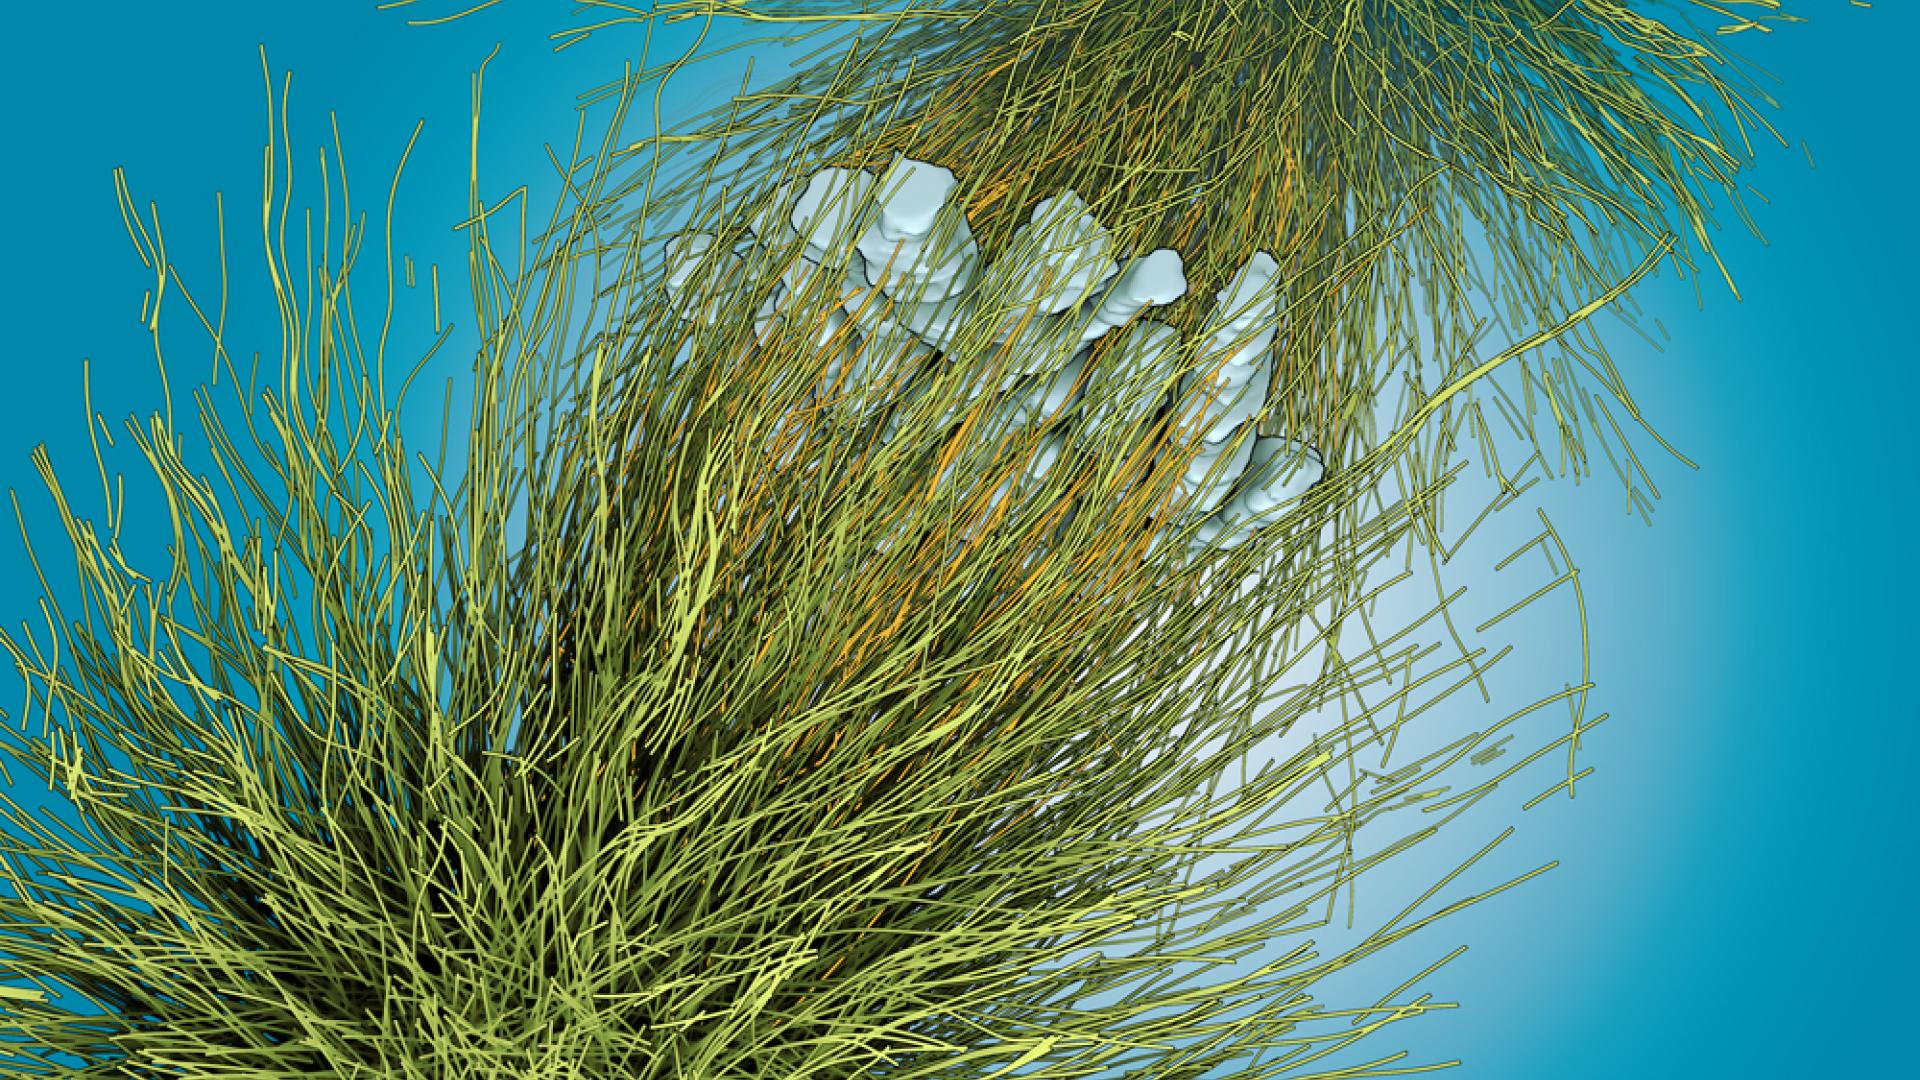
 Four examples of growth cones with extending filopodia of varying number and shape, displayed as volume renderings for individual time points from in-vivo microscopy image time series. Data courtesy R. Hiesinger.
With new microscopy technology, the group of R. Hiesinger (FU) is able to acquire in-vivo 4-D movies of axons growing in drosophila brains, which shed new light on the brain wiring process. The filopodia dynamics feature a much richer structure than would be necessary for stochastic gradient sampling (figure 6). Currently, the role of these complex dynamics for brain wiring is essentially unknown.
Looking for Simplicity
The genome is too small for encoding the brain wiring explicitly. Thus, the pattern must emerge from rather simple regulatory mechanisms encoded in the genome (FN:.A. Hassan and P.R. Hiesinger. Beyond molecular codes: Simple Rules to Wire Complex Brains. Cell 163:285–291, 2015.). One compelling hypothesis is that these developmental rules do not only tolerate randomness in the axons’ environment, but use stochasticity as a driving force and to achieve robustness.
 Statistics of filopodia dynamics extracted from 4-D microscopy data. Length, a characteristic quantity, appears to be correlated with filopodia lifetime, and differs between mutants (green) and wild type (blue) for growth cones during synaptogenesis. Data courtesy of R. Hiesinger.
In a joint Matheon project with M. von Kleist (FU), we aim at identifying mechanistic models that are both physically plausible and able to reproduce observed wiring patterns and the statistics of filopodia dynamics (figure 7). The simpler and more general the mechanisms forming such a model are, the more one can expect that structurally similar processes are actually driving the neural development.
As a first candidate, we consider a model comprising three essential components. First, diffusion and decay of guidance molecules in the extracellular space seem necessary for inter-axon communication. Second, reception of guidance molecules by the filopodia is a stochastic process due to the low concentration. Finally, nonlinear reactions within the axons, affected by the sensing of guidance molecules, control growth and retraction of filopodia as well as release of guidance molecules (FN: C.-C. Chan, D. Epstein, R. Hiesinger. Intracellular Trafficking in Drosophila Visual System Development: a Basis for Pattern Formation through Simple Mechanisms. Dev. Neurobiology 71:1227–45, 2011.).
For simulating such models, solvers for deterministic partial differential equations describing diffusion, reaction, and transport processes need to be coupled to a stochastic simulation algorithm [6] capturing the random events of guidance molecule reception and filopodia growth.
One of the simplest models of this type, containing just a single type of guidance molecule, can already create robust and quasi-regular space-filling axon structures that avoid self-contact as well as neighbor contact (figure 8).
 25 axons in a spatially periodic setting growing to a robust and quasi-regular space-filling but contact-avoiding pattern.