Solutions for advance analysis questions
Microscopy techniques are becoming an increasingly important tool for research in biology. They are key to analyzing biological systems on various scales, from the structure of biomolecules, using electron microscopy, up to whole organs, using optical microscopy. ZIB helps to create an understanding of biological systems through image-analysis solutions. We develop analysis methods and software that biologists apply to answer advanced analysis questions.

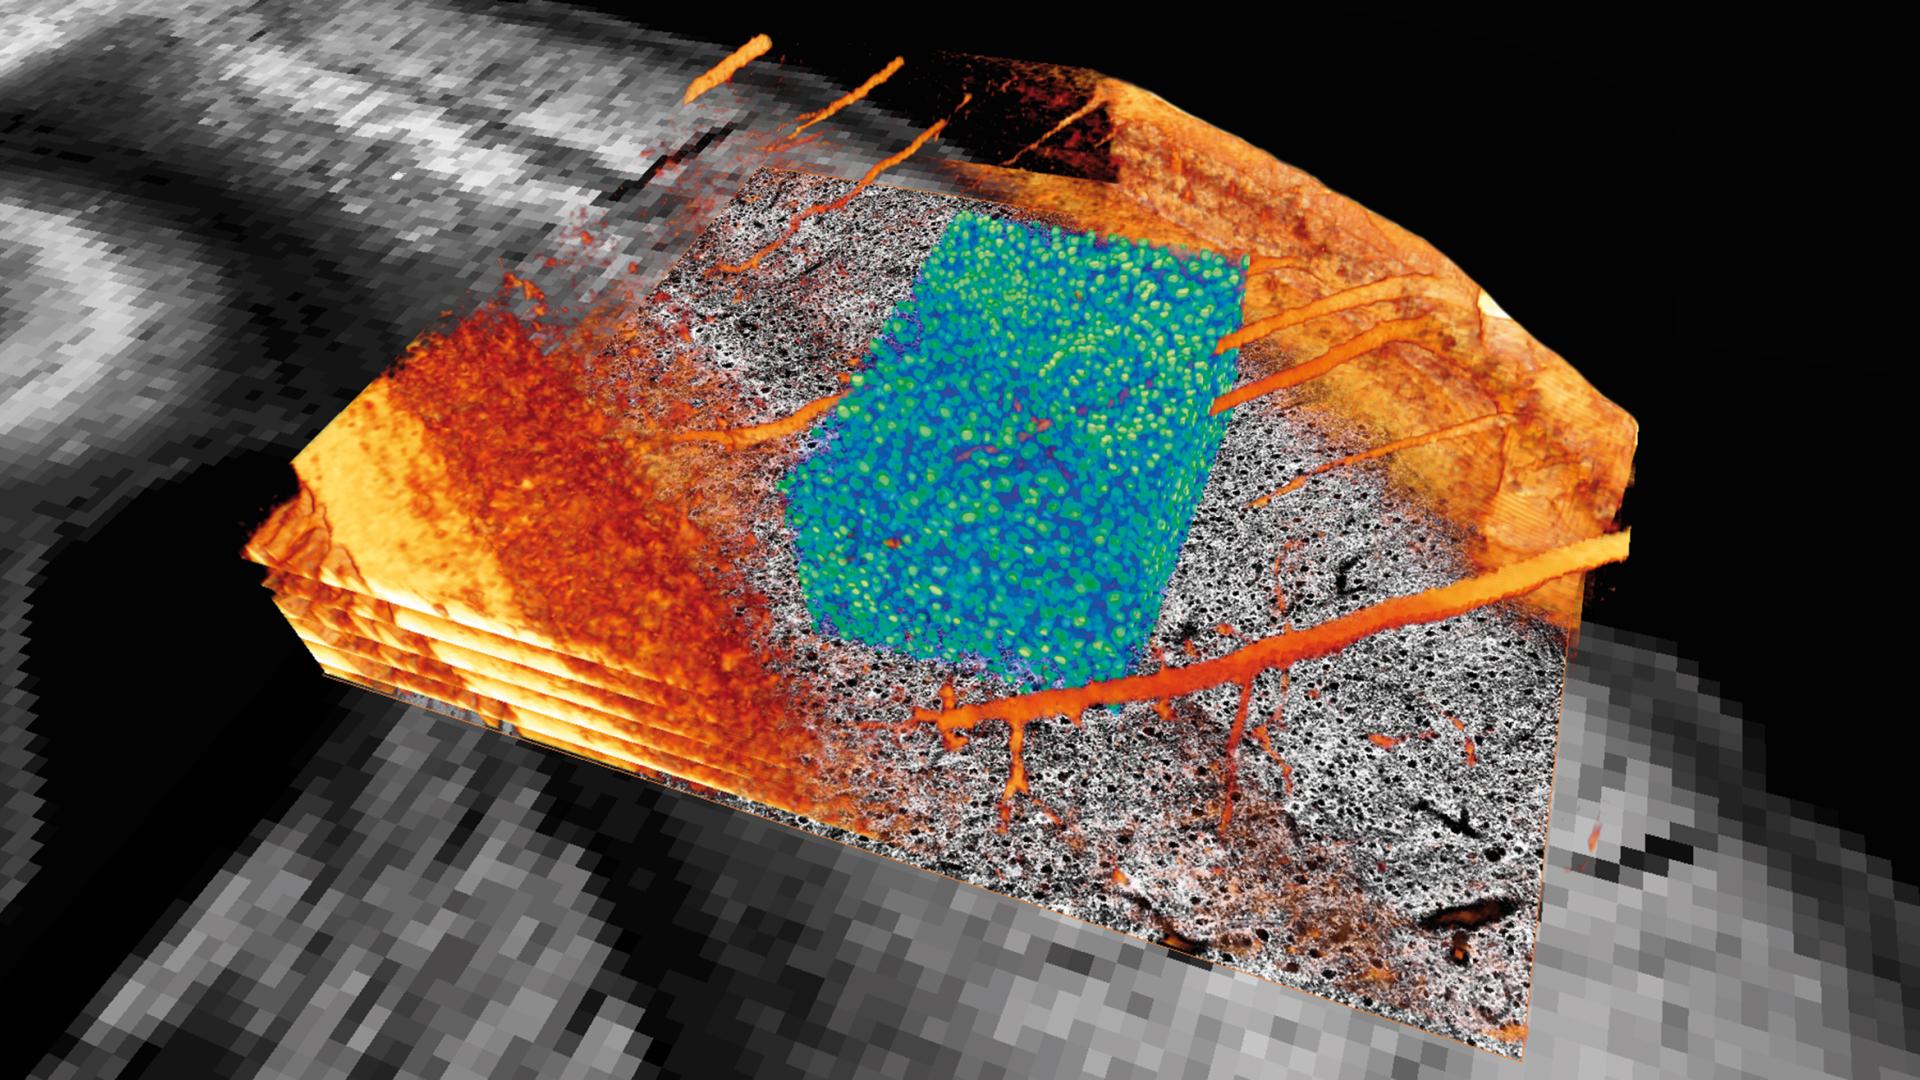
Section of the cortex of a mouse brain. Neuron cell bodies in blue green. Blood vessels and other structures in orange. Image slices in gray.
RECONSTRUCTION AND ANALYSIS OF THE MICROTUBULE SPINDLE USING ELECTRON TOMOGRAPHY
Microtubules are tube-like polymers that play an important role in cell division. They form the spindle - a microtubule assembly that segregates the chromosomes. One important method for investigating microtubules in cells is electron tomography. Thick (300 nm) serial sections of cells are prepared for electron microscopy and imaged on a CCD camera. With the application of image-processing techniques, we are able to automatically extract the centerlines of microtubules within a section (FN: B. Weber, E.M. Tranfield, J.L. Höög, D. Baum, C. Antony, T. Hyman, J.-M. Verbavatz, S. Prohaska [2014]: Automated stitching of microtubule centerlines across serial section tomograms. PLoS ONE, p. e113222, doi: 10.1371/journal.pone.0113222)(FN:S. Redemann, B. Weber, M. Möller, J.-M. Verbavatz, A. A. Hyman, D. Baum, S. Prohaska, T. Müller-Reichert [2014]: The Segmentation of Microtubules in Electron Tomograms Using Amira. Mitosis, Springer, 2014, doi: 10.1007/978-1-4939-0329-0_12)(FN:B. Weber, G. Greenan, S. Prohaska, D. Baum, H.-C. Hege, T. Müller-Reichert, A. Hyman, J.-M. Verbavatz [2012]: Automated tracing of microtubules in electron tomograms of plastic embedded samples of Caerhabditis elegans embryos. Journal of Structural Biology, 178[2], pp.129-138, doi: 10.1016/j.jsb.2011.12.004). Furthermore, we have been developing reconstruction methods for a quantitative analysis of full mitotic spindles. These methods allow joining electron tomograms and extracted microtubule centerlines across physical sections to create a geometric model of the entire spindle (FN:Britta Weber, Marit Möller, Jean-Marc Verbavatz, Daniel Baum, Hans-Christian Hege, Steffen Prohasks [2011]: Fast Tracing of Microtubule Centerlines in Electron Tomograms. BioVis 2011 Abstracts, 1st IEEE Symposium on Biological Data Visualization). The development started in collaboration with the MPI-CBG Dresden and is now being used in several biology laboratories worldwide. With the achieved level of automation, the analysis of microtubule organization for large parts of the cell from serial-section electron tomography now seems feasible for the first time. The results will be visually and quantitatively analyzed.
Microtubule traced from electron tomograms. The simulated atomic structure has been added for illustration. 
Traced microtubules for a stack of serial section electron tomograms. The simulated atomic structure has been added for illustration.
MODELING SYNAPTIC CONNECTIVITY IN ANATOMICALLY REALISTIC NEURAL NETWORKS
Neuroscientists would like to understand how the brain processes sensory information, and how this ultimately leads to certain behavior. To investigate this, our collaborators (Oberlaender Group, MPI for Biological Cybernetics, Tübingen) used the rat somatosensory (barrel) cortex, which processes information from the whiskers, as a model system. The brain is comprised of a large number of interconnected neurons, which have a complex tree-shaped form, allowing them to communicate with many other nerve cells over potentially long distances. Together with our project partners, we developed methods for the detailed 3-D reconstruction of the individual neuron’s shape from microscopic images, including its complex and long-ranging axonal arbor (FN:V. J. Dercksen, H.-C. Hege, M. Oberlaender [2014]: The Filament Editor: An Interactive Software Environment for Visualization, Proof-Editing and Analysis of 3D Neuron Morphology. Neuroinformatics, 12[2], pp. 325-339.). Based on such carefully reconstructed anatomical data, we created a 3-D digital model representing the rat barrel cortex (FN:R. Egger, V.J. Dercksen, D. Udvary, H.-C. Hege, M. Oberlaender [2014]: Generation of dense statistical connectomes from sparse morphological data. Frontiers in Neuroanatomy, 8[129], DOI: 10.3389/fnana.2014.00129) consisting of approximately 0.5 million neurons and their synaptic connections. The model is able to reproduce important network properties that have been reported in the literature (for example convergence) and could therefore be used to predict other network properties that are difficult to access through laboratory experiments. This model provides insight into the neural circuits that process touch information and can, for example, serve as the anatomical basis for simulating the flow of information through parts of the brain.

Cell-type-specific synaptic connectivi-ty in the rat barrel cortex. A 3-D model of the rat barrel cortex was created by placing a measured number of neuron reconstructions (left) in a reference frame defined by the pia (top), and white-matter (bottom) surfaces and 24 cortical columns (illustrated by the transparent cylinder and the contours at the top). From this dense model, we can estimate synaptic connectivity between individual neurons or at the level of cell types. Shown are the complex dendritic (red) and axonal (black) trees of a single-layer 5 thick-tufted cell. Through their long and complex axonal branches, neurons of this type make many synaptic contacts in the surrounding cortical columns, mainly at the top of the barrel cortex (orange).
Understanding Biomaterials
Many biological materials are composites with a hierarchical structure (FN:Fratzl, Peter, and Richard Weinkamer. "Nature’s hierarchical materials." Progress in Materials Science 52.8 [2007]: 1263-1334.).
In order to understand the hierarchical nature of materials, they are investigated on different length scales using a variety of imaging techniques, including medical CT, micro-CT, electron microscopy (EM), nanoindentation (NI), and small-angle X-ray scattering (SAXS). At ZIB, we develop automated techniques for image registration, segmentation, and analysis of data from such imaging techniques. In collaboration with the MPI of Colloids and Interfaces in Potsdam- Golm, we have shown in two projects how automated image-analysis techniques help in understanding the structure of biological materials.
REGISTRATION OF 2-D IMAGE DATA INTO 3-D VOLUMETRIC DATA
The first project, a collaboration with Wolfgang Wagermaier and Rebecca Hoerth is aimed at understanding bone healing after fracturing. For different fracture gaps of rat bones, the healing process was studied. Of particular interest here was the orientation of the mineral platelets in the fractured regions during the healing, which was studied using SAXS imaging, a 2-D imaging technique with very high resolution. In order to better understand the results of this imaging technique, the 2-D SAXS images were integrated into the 3-D volume of the bone obtained using micro-CT. We developed a multistep semiautomatic registration method using 2-D EM images as a methodic link (FN:Rebecca M. Hoerth and Daniel Baum and David Knoetel and Steffen Prohaska and Bettina M. Willie and Georg N. Duda and Hans-Christian Hege and Peter Fratzl and Wolfgang Wagermaier [2015] "Registering 2D and 3D Imaging Data of Bone during Healing", to appear in Connective Tissue Research.).In a first step, the SAXS images were registered to the 2-D EM image, which was then registered to the 3-D micro-CT image. We developed an approach using a combination of the generalized Hough transform and image-based optimization to register the 2-D EM images into the 3-D volumes with only minor user interaction. We could register all data sets within less than one hour while spending only 10-15 minutes of manual labor per slice [8].

Integration of information from small-angle X-ray scattering (SAXS) into 3-D density image acquired using μmicro-CT. The first row shows the input data: (a) Volume rendering of micro-CT image. (b) EM image. (c) SAXS image, which can be easily superimposed with EM; the quan-tity T is the mean thickness of the particles measured using SAXS; the barcode shows the predominant orientation. The second row shows the intermediate (d) and final results (e, f): (d) Result of the registration displayed using blending. Registration of SAXS image using EM as methodic link. (f) Same as (e) but without EM image.
ANALYSIS OF SKELETAL ELEMENTS OF CARTILAGINOUS FISH
In a second project, we have been developing methods for image segmentation and shape analysis in collaboration with Mason Dean and Ronald Seidel. The proj-ect focus is the skeletons of carti-laginous fishes (sharks and rays), which are covered by a mineralized layer composed of a network of tiles, called tesserae. This mineralized layer is known to stabilize the skeletal elements. But many questions concerning the properties, the distribution, and the growth of these tesserae remain unanswered (FN: Dean, Mason N., et al. [2009] "Ontogeny of the tessellated skeleton: insight from the skeletal growth of the round stingray Urobatis halleri." Journal of Anatomy 215.3: 227-239.), in part because no methods were available for quantifying the shapes and arrangements of the massive number of tesserae on each skeletal element. The methods we have been developing allow us to investigate the anatomy of the mineralized layer at various levels of structural hierarchy, working from micro-CT and synchrotron-CT scans of tessellated (tiled) cartilage. In his master’s thesis (FN:David Knoetel. "Segmentation of ray and shark tesserae", Master's thesis at FU Berlin [2014].), David Knoetel developed an automated image-analysis pipeline to seg-ment tesserae at different levels of detail and then reduce the complex network to a series of data visualizations to facilitate analysis. On a different length scale, bachelor student Merlind Schotte works on the automatic extraction of shape parameters from entire skeletal elements based on principal component analysis, enabling the comparison of shapes across different species of sharks and rays. These analyses of structural complexity on different size scales provide a unique window into the organization, growth, and mechanics of this interesting biological tissue composite and are invaluable input for bio-inspired modeling projects.

Workflow for tesserae segmentation. From top to bottom: (1) Data set to be segmented, rendered using volume rendering. (2) Volume rendering of subregion. (3) Isosurface. (4) Distance map for binary segmentation. (5) Automatic segmentation of distance map. (6) Connectivity graph of segmented region with volume rendering. (7) Manually corrected segmentation. (8) Final segmentation of tesserae.
Visual Data Analysis Software Amira

Amira is commercial software for visualization and data analysis with approximately 7,000 users worldwide. The initial version of Amira was developed at Zuse Institute Berlin (ZIB) in 1994 in response to the lack of an interactive, simple-to-use, and extensible software solution for non-computer scientists that wanted to apply visualization.
Today, Amira is commercially developed and distributed by FEI Visualization Sciences Group. ZIB still contributes to the development of Amira through technology transfer, based on a long-term cooperation with FEI that funds the development of novel algorithms at ZIB. The transfer allows ZIB to distribute its methods to a large audience while bene-fiting from the maintenance and support of the company. Support for several oper-ating systems, code maintenance, and bug fixes are provided over the long term, which helps to ensure that Amira is a reliable framework for biological image analysis.
Amira is also used as the basis for many research projects at ZIB and is freely available to ZIB cooperation partners. ZIB offers selected image-analysis solutions for download on the Web site, as extensions to Amira to allow researchers to reproduce and apply methods that have been developed and published by ZIB. Sharing our solutions provides direct value to the research community and helps us to test and verify our algorithms. Examples are the automated segmentation of actin filament networks, tracing of microtubules, and the 3-D reconstruction of neurons.
In recent years, ZIB contributed several improvements for image analysis to Amira, such as tools for interactive image segmentation and for deriving quantitative information from reconstructed geometry. One highlight is a work flow for automatic and semiautomatic re-construction of filamentous structures from electron tomograms. With this new work flow, Amira provides a unique solution that is used by laboratories worldwide for analyzing microtubule organization during cell division.