New navigation systems for aircraft save fuel and time
Cheap air transport has become a matter of course since the 1980s. It allows us to see the world and visit remote countries on vacations, as well as to attend multiple business meetings per week around the country or continent, and to still sit down for dinner with the family at home in the evening. Because of these amenities, the market for passenger transportation has been and will be a growing one.
According to a recent forecast by the International Air Transport Association (IATA) (FN:International Air Transport Association [IATA]: 20 Year Passenger Forecast, 2017. http://www.iata.org/pressroom/pr/
Pages/2017-10-24-01.aspx), the current number of four billion air travelers per annum will double by 2036. As air connectivity of countries is assumed to be a stimulus for growth and prosperity (FN:PricewaterhouseCoopers: Connectivity and Growth, 2017. https://www.pwc.com/gx/en/
industries/assets/connectivity-
and-growth-2017-edition.pdf), such prognoses are good news. However, the increase in air-traffic volume also presents challenges: the infrastructure needs to be constantly adapted to handle ever-larger numbers of passengers, the safety of passengers and crews needs to be ensured, and emissions of CO2 and other pollutants should be minimized.
The past decades have witnessed a significant improvement regarding the environmental impact. For example, in figure 1, we can see how the Lufthansa Group managed to reduce the fuel consumption of their fleet to 3.85 l per passenger and per 100 km during 2017. The most obvious factor contributing to this is technical progress of aircraft, and particularly engines (FN:The International Council on Clean Transportation: Efficiency Trends for New Commercial Jet Aircraft, 1960 to 2008, 2009. http://www.theicct.org/sites/default/
files/publications/
ICCT_Aircraft_Efficiency_final.pdf). However, as aircraft are often used for around 25 years, fleet renewal is a long-term task for an airline. Therefore, short-term measures, such as minimizing fuel consumption through efficient trajectory planning, are equally important. Here is where ZIB comes into play.
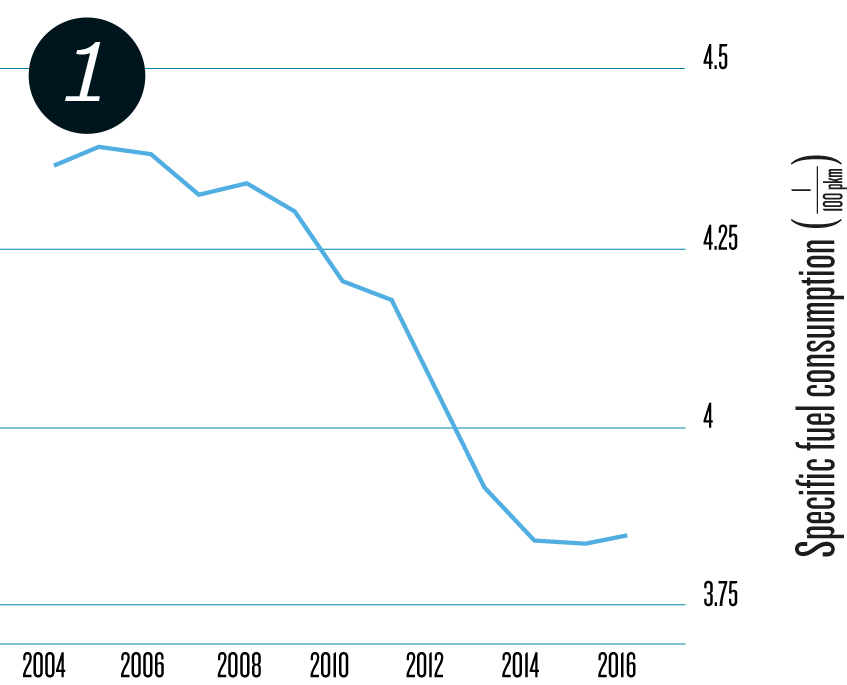 Specific fuel consumption for the Lufthansa fleet (source: (FN:Lufthansa Group: Nachhaltigkeitsbericht, 2004–2016. https://www.lufthansagroup.com/de/
verantwortung/
nachhaltigkeitsberichte.html))
Together with Lufthansa Systems GmbH & Co. KG, a leading provider of IT solutions to the airline industry, the Optimization department at ZIB is working on the development of VOLAR, a brand-new system for flight-trajectory optimization, which will ultimately become the core optimizer of Lufthansa Systems’ flight-planning software Lido/Flight. Similar to a car navigation system, many airlines use Lido/Flight to compute the most efficient routes for their aircraft. Unlike in car navigation, however, a plane cannot stop in midair if something goes wrong. The weather plays a much more important role. And fueling is really critical. Too much is not good, as every liter of kerosene must be lifted into the air, requiring even more fuel. Too little, however, is even worse. Balancing safety and efficiency is therefore a delicate task, which must be addressed with advanced mathematical methods. This is also the way to deal with all the constraints of flight planning.
Aircraft are not allowed to fly along the shortest curve between any two airports. Instead, they must adhere to airways, which are invisible roads in the sky spanning the entire planet. The set of all such airways and their intersections define the airway network. In mathematics, such a construct is called a graph. The set is not only defined on one altitude, but on several layers stacked on top of each other. These layers, roughly 300 m apart, correspond to the possible altitudes on which aircraft are allowed to cruise.
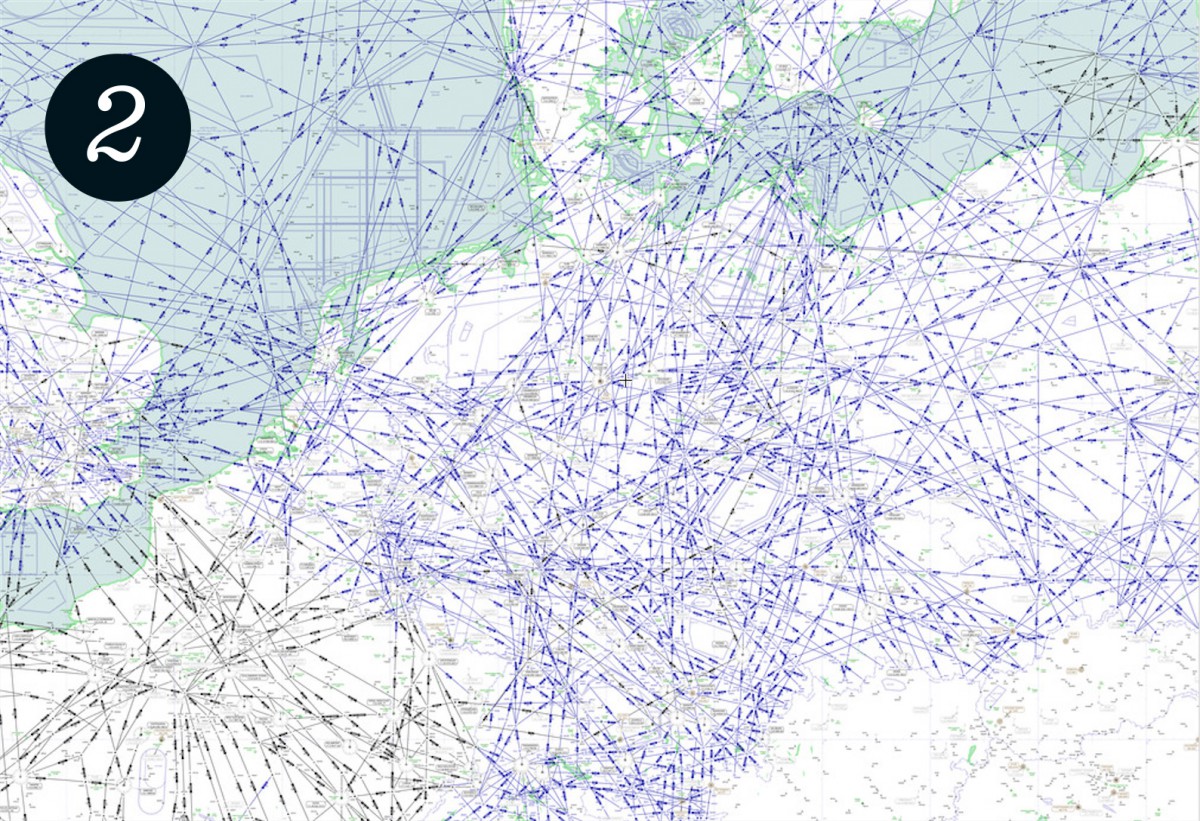 Airway network over Germany (source: skyvector.com).
A representation of the airway network over Germany can be seen in figure 2.
After fixing a pair of airports as the departure and the destination nodes in this graph, the main objective of flight planning is to find a minimum cost path – a chain of airways – connecting them. The problem of computing a minimum cost/shortest path between two nodes on a graph is well studied and also very relevant in real-world applications. Pedestrians in the city try to walk along paths with minimum distance. Car navigation systems seek to find the shortest path to a destination by minimizing the total travel time, which may vary depending on traffic. The flight-planning problem is similar in nature, but it has a much more complex cost function.
The relevant cost components for flight-trajectory optimization are fuel consumption (which is usually correlated to flight time) and overflight fees. While the latter play a big role for airlines and are very interesting from the mathematical point of view (FN:M. Blanco, R. Borndörfer, N.D. Hoang, A. Kaier, P. M. de las Casas, T. Schlechte, S. Schlobach: Cost Projection Methods for the Shortest Path Problem with Crossing Costs. 17th Workshop on Algorithmic Approaches for Transportation Modelling, Optimization, and Systems [ATMOS]. 2017.), fuel consumption is by far the most important factor. Its computation is not straightforward, since it heavily depends on the weather. This can be best understood by considering jet streams, which are currents of strong wind. The best-known example is the jet stream around the North Pole, which blows east and is particularly rele-vant for aviation over the Atlantic. Flying along jet streams significantly decreases both flight time and fuel consumption. Similarly, flying in the opposite direction should be avoided, which is why flights from Europe to North America often make a detour over Greenland. The jet stream is clearly visible over North America in figure 3.
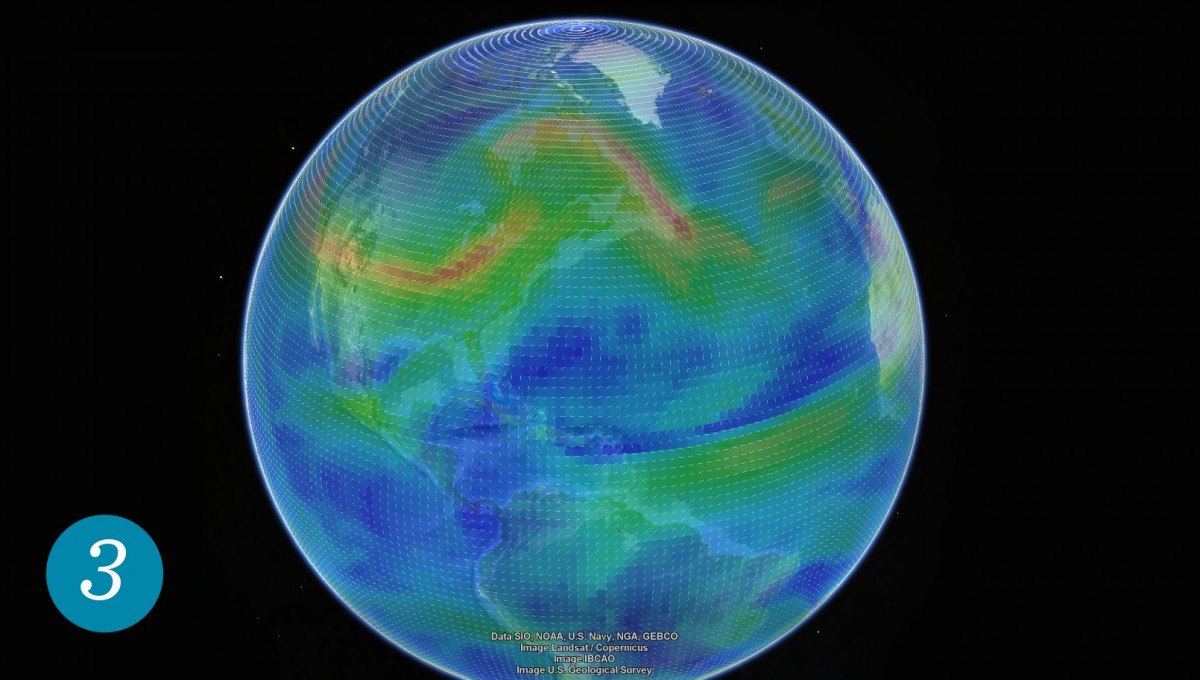 High-altitude wind over the American continent on a specific day. Blue is still air, strong wind is represented in red. (Representation: Google Earth)
In a sense, wind on airways is similar to traffic jams on roads, since it can reduce or increase an airway’s effective length, or even block it. Considering such time-dependent factors during optimization is always a major challenge, as a lot of data has to be processed. For instance, weather data is needed not only on the horizontal level, but also on the vertical level and on a time horizon of more than 24 hours.
Furthermore, fuel consumption at any given time is dependent on the aircraft’s weight (which itself depends on the current fuel amount) and altitude. In general, lighter aircraft are more efficient than heavier ones, and flying at high altitudes is better than at low altitudes. However, given that the wind is stronger at high altitudes, it sometimes makes sense to fly lower to avoid strong headwinds.
Besides the complex cost function, there are many other challenges to consider in the flight-planning problem. A good example is the diverse constraints.
On the one hand, there are so-called aerodynamic constraints. These are given by the flight dynamics, which determine, for example, how steep the climb or descent angle can be. For instance, it is important to know exactly at what moment to initiate the final descent, so that the destination airport can be reached comfortably. Also, it is important to always have enough fuel onboard to reach an alternate airport in case of an emergency, such as an engine failure.
On the other hand, there are less obvious operative constraints, which regulate how the airspace may be used. These constraints have objectives such as avoiding congestion, ensuring safety, and enforcing regional legislation (such as night-flying restrictions to reduce noise). These constraints are managed by air-navigation service providers around the world (e.g. EUROCONTROL in Europe, through the monthly Route Availability Document publication). Such a restriction can, for example, forbid the usage of Belgian airways for flights departing from Luxembourg on weekdays after 10 p.m. In this case, it is easy to imagine why this restriction is published: aircraft would fly at low altitudes over the Belgian airspace, hence causing too much noise at night. As of January 2018, the European Route Availability Document consists of over 13,000 restrictions. Considering all of them during the search for an optimal flight trajectory increases the problem’s complexity considerably, since they make it NP-hard.
Another example of human-made constraints are comfort constraints, which are not easy to model but intuitively are clear. In particular, the most fuel-efficient route sometimes results in a pattern that pilots are unlikely to follow, such as in figure 4.
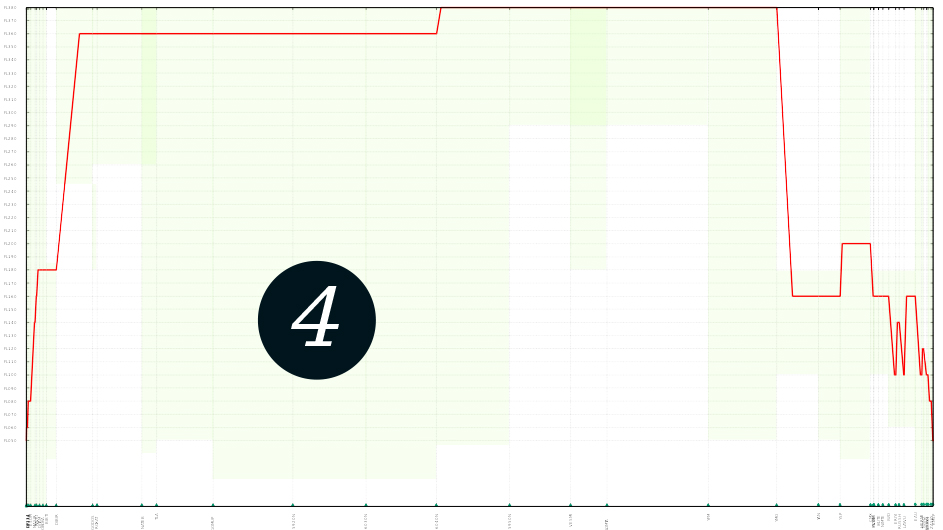 The vertical profile of a flight computed between Frankfurt and Minneapolis. The final segment follows a “zigzag” pattern, efficient with respect to fuel consumption but probably uncomfortable for the passengers.
Currently, the VOLAR software developed at ZIB is capable of computing optimal trajectories that consider weather, aircraft performance, overflight fees, and traffic restrictions. It is based on original research that has been well received in the operations-research community. As an example, Adam Schienle’s master’s thesis (FN:A. Schienle: Shortest Paths on Airway Networks, Master’s thesis, Freie Universität Berlin, 2016.), which focuses on minimizing flight time under consideration of wind, won awards both at the OR conference in Berlin and the Gemeinnützige Gesellschaft zur Förderung des Forschungstransfers e.V., both in 2017. Furthermore, the research paper (FN:M. Blanco, R. Borndörfer, N.D. Hoang, A. Kaier, A. Schienle, T. Schlechte, S. Schlobach: Solving Time Dependent Shortest Path Problems on Airway Networks Using Super-Optimal Wind, 16th Workshop on Algorithmic Approaches for Transportation Modelling, Optimization, and Systems [ATMOS], 2016.) won the prestigious Best Paper Award at the international Algorithmic Approaches for Transportation Modeling, Optimization, and Systems workshop (ATMOS 2017). The scope of these works is as follows.
 Adam Schienle at the award ceremony of the GFFT.
Since both a short runtime and low memory usage are essential in real-world flight planning, it is necessary to restrict the search space of our algorithms. Roughly speaking, this means that if we want to fly from Berlin to Tenerife, there is little sense in looking for a flight trajectory overflying Russia. This was in part achieved after introducing the Super-Optimal Wind, which is based on a simple observation: aircraft travel faster when being pushed along by tailwinds (wind from the back), and when there is as little crosswind (wind from the side) as possible. Hence, we can calculate the “best” wind conditions we may expect for a given weather forecast. This allows the search space to be reduced drastic-ally. Furthermore, it also ensures that the optimal route is not cut off by this reduction. This is done by adapting the well-known A* algorithm.
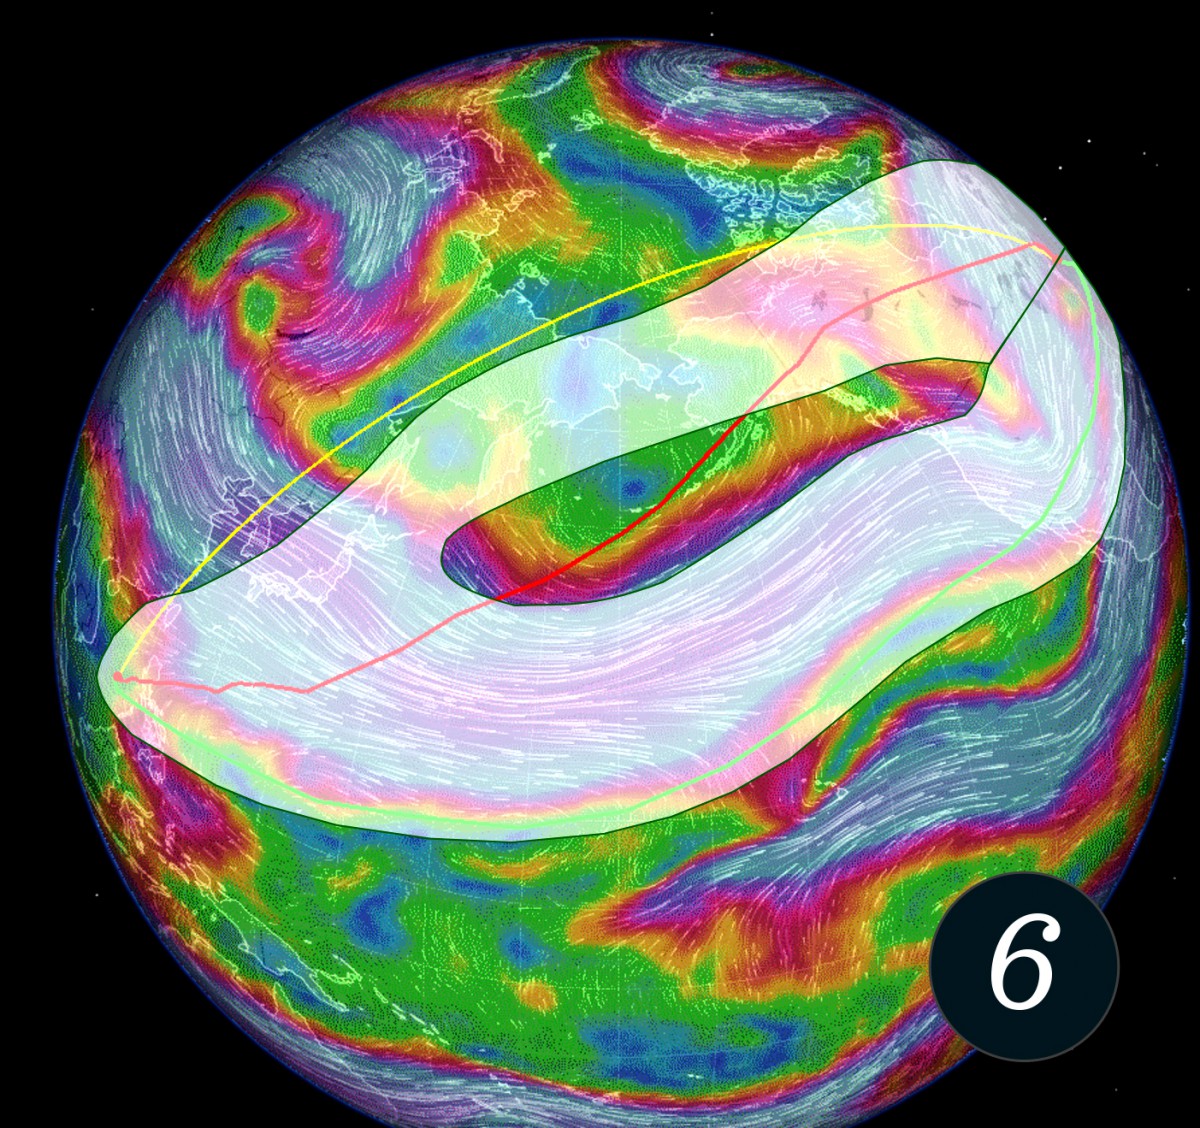 Two routes from Taipei to New York: the red one was precomputed, the green one was computed by VOLAR.
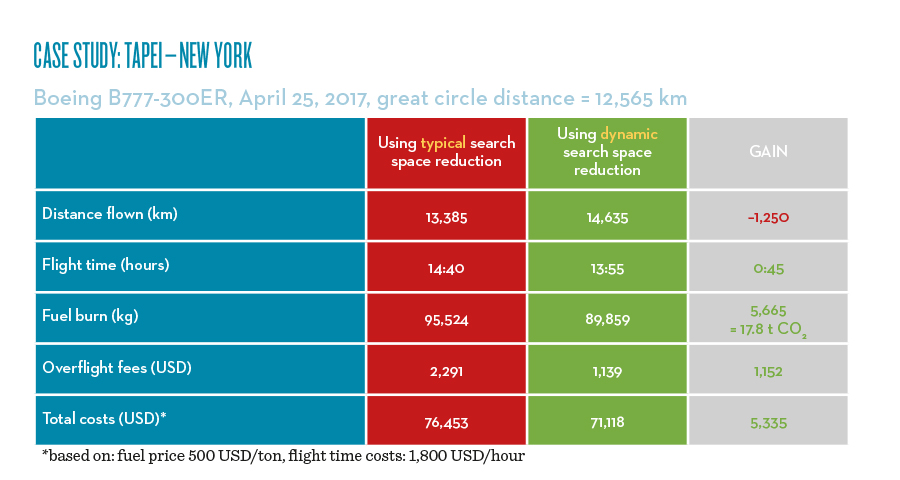
The efficiency of this method can be demonstrated at the following striking example. On April 25, 2017, at 3:00 a.m. UTC, a flight leaving Taipei Taoyuan Airport was scheduled to go to New York John F. Kennedy International Airport.On that day, there was an unusually strong jet stream above the Northern Pacific. While for airlines it is common to fly routes that lie close to a geodesic between the departure and destination airports, on this day, flying a big detour to take advantage of the unusual jet stream paid off. Figure 4 shows this phenomenon. The yellow line represents the great circle connection between Taipei and New York. The red line shows a common flight route between both cities and the green one was computed by VOLAR, taking advantage of the jet stream described above. The shaded area (in gray) in figure 6 shows the search space inspected by VOLAR (i.e, the regions in which the optimal route is looked for). To do so, VOLAR uses the Super-Optimal Wind. It is remarkable that the red route is not even considered by our algorithm, since it lies partially outside of the shaded area – it is simply not a potential candidate for the optimal trajectory. Indeed, as the table in figure 6 shows, the green route saves 5,665 kg of fuel and 5,335 USD compared to the red one, even though it is significantly longer.
